IEEE Journal of Biomedical and Health Informatics, Vol. 27, No. 10 · 2023
Video-Based Activity Recognition for Automated Motor Assessment of Parkinson’s Disease
Grzegorz Sarapata, Yuriy Dushin, Gareth Morinan, Joshua Ong, Sanjay Budhdeo, Bernhard Kainz & Jonathan O’Keeffe
Abstract
Over the last decade, video-enabled mobile devices have become ubiquitous, while advances in markerless pose estimation allow an individual’s body position to be tracked accurately and efficiently across the frames of a video. Previous work by this and other groups has shown that pose-extracted kinematic features can be used to reliably measure motor impairment in Parkinson’s disease (PD). This presents the prospect of developing an asynchronous and scalable, video-based assessment of motor dysfunction. Crucial to this endeavour is the ability to automatically recognise the class of an action being performed, without which manual labelling is required.
Representing the evolution of body joint locations as a spatio-temporal graph, we implement a deep-learning model for video and frame-level classification of activities performed according to part 3 of the Movement Disorder Society Unified PD Rating Scale (MDS-UPDRS). We train and validate this system using a dataset of n = 7310 video clips, recorded at 5 independent sites. This approach reaches human-level performance in detecting and classifying periods of activity within monocular video clips.
Our framework could support clinical workflows and patient care at scale through applications such as quality monitoring of clinical data collection, automated labelling of video streams, or a module within a remote self-assessment system.
Index Terms — activity recognition; computer vision; graph neural networks; Parkinson’s disease; telemedicine
Introduction
Human Activity Recognition (HAR) is the process of detecting and classifying human actions through sensor data.1 The widespread availability of easy-to-use video recording devices increases the appeal of computer-vision-based HAR, operating on a sequence of captured images. An automated activity recognition framework would facilitate many practical applications such as behavioural analysis,2 automatic security surveillance,3 and human-computer interactive systems.4
In the context of healthcare, HAR has found use as an assistive tool for patient monitoring, remote medicine services or eldercare.5,6 Mobile health technology has been shown to effectively complement traditional public health services, and the rapid growth of its popularity further motivates the development of machine-driven HAR.7,8 However, HAR remains challenging, due in part to the complexity of scenes and human movements.9
Parkinson’s disease (PD) severity is often assessed using the Movement Disorder Society Unified PD Rating Scale (MDS-UPDRS).13 Part 3 of this four-part assessment comprises 14 motor activities performed by the patient and rated by an examining clinician. The in-person character and duration of the assessment impose constraints on the frequency of patient monitoring efforts, as patients typically travel to each assessment site and clinician time is finite. These limitations may be offset by a remote, asynchronous and self-administered system capable of collecting and analysing data with a high frequency and at scale. To automatically guide the patient through an assessment and validate that each motor task has been completed, an assessment-focused activity recognition framework needs to be developed. In addition to enhancing patient care, such a system could be used to automatically annotate large quantities of motor assessment data in clinical trials, greatly increasing the statistical power of future PD research.
In recent years deep learning (DL) techniques have increasingly been applied to HAR. Facilitated by large datasets and faster computing, DL frequently yields superior performance compared to more traditional “shallow” techniques. An added benefit of many DL methods is the end-to-end learning and prediction setup, removing the need for feature engineering and validation.14,15
Previous HAR work broadly falls into two categories according to input data, accelerometer data16 and image data. Within vision-based HAR, two further subdivisions can be delineated: (1) pixel-based activity recognition from a video stream,17,18 which processes the video input captured by a camera directly, allowing the model to extract features describing both the human subjects and their surroundings — however, the typically large input dimensionality makes these methods vulnerable to over-fitting in the absence of vast quantities of training data, which may prevent such systems from generalising well;19 and (2) a two-step framework whereby human pose estimation (i.e. annotation of body joint locations) is performed first, followed by activity recognition based on the estimated key points20,21 — here, the prediction errors from both pose estimation and activity recognition modules may compound, but the great dimensionality reduction implicit in the first stage appears to more than compensate, resulting in good performance on tractable data sets.
In the context of Parkinson’s disease, HAR methods have been applied to recognise a set of universal activities such as walking or standing,22,23 but its application to the clinically relevant MDS-UPDRS motor assessment remained, to our knowledge, unexplored. Additionally, the performance of deep learning methods in medical settings is often limited by the amount of available training data, preventing in-depth evaluation of typically data-hungry deep learning frameworks.24
In this work, we present an application of vision-based HAR method for the classification of motor assessment tasks performed by Parkinson’s patients. We train a deep learning model to classify patient’s activity based on estimated body joint locations obtained using an open-source pose estimation library OpenPose25 and evaluate the approach using a large multi-site dataset of MDS-UPDRS part 3 assessment video recordings. We extend the framework beyond video-level activity classification to perform the prediction on a frame-by-frame basis, allowing the model to recognise multiple activities in any order within a single video clip of arbitrary length and specify the beginning and the exact duration of the activity. This flexibility predisposes the system to a greater number of real-world applications.
Methods
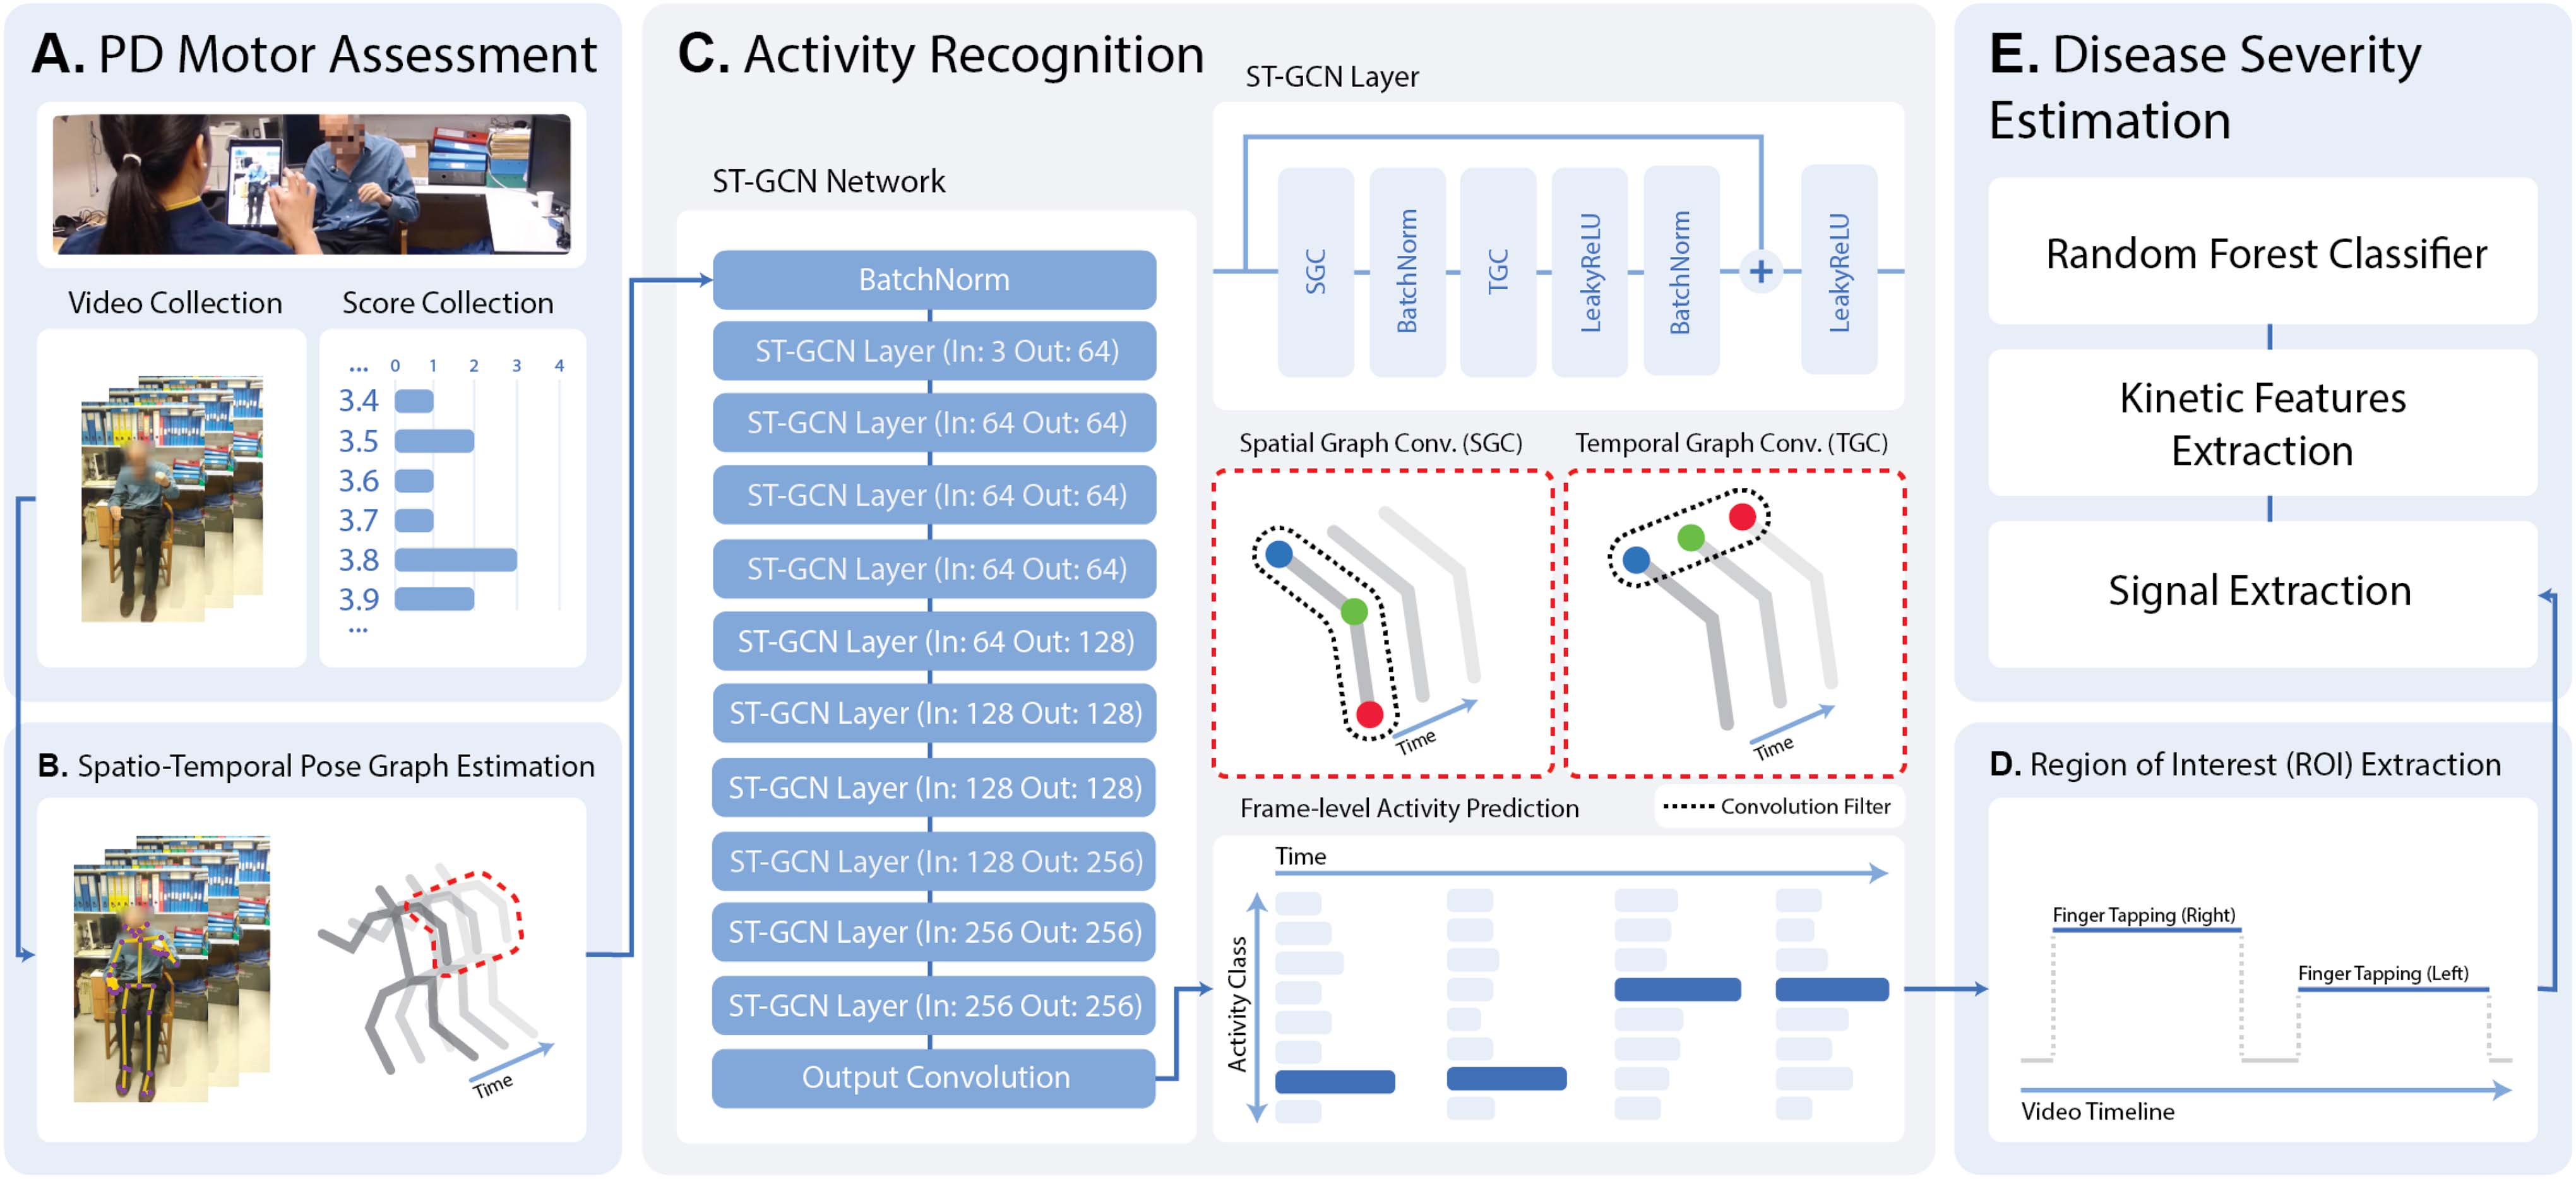
Fig. 1 illustrates the pipeline for video collection, pose estimation, and activity recognition. The introduced activity recognition module can facilitate the automatic localisation of MDS-UPDRS motor tasks within videos, accommodating further analysis such as model-based disease severity estimation. Clinical assessments of Parkinson’s patients were conducted across multiple centres in the U.K. and USA, in the course of clinical care. Video recordings of these assessments were collected through KELVIN™,26 a video-based motor assessment platform developed by Machine Medicine Technologies (MMT).27
Data
Activity classes. The MDS-UPDRS instructions specify a set of items to be performed by a patient and evaluated by an expert clinician in terms of PD symptom severity. In our dataset, every assessment has been recorded and saved in the form of multiple video clips, one video per item. For training of the activity recognition model, we selected a subset of items that can be performed without assistance, taking into consideration overall informativeness about a patient’s holistic disease state.28 Some MDS-UPDRS items correspond to two distinct activities, such as left and right hand Finger Tapping. This has been reflected in the activity class labels, shown in Table I, as the model makes the distinction between laterals. An additional No Action class has been included to indicate when patients are not performing any of the target activities.
Multi-site patient population. The data include 7310 videos recorded as part of 1170 PD motor assessments completed at five sites: DCMN (Department of Clinical and Movement Neurosciences, Institute of Neurology, University College London), NRC (Neuroscience Research Centre, Molecular and Clinical Sciences Research Institute, St. George’s, University of London), DRC (Dementia Research Centre, Institute of Neurology, University College London), PDMDC (Parkinson’s Disease and Movement Disorders Centre, Baylor College of Medicine), and TSL (The Starr Lab, University of California San Francisco).
To evaluate the cross-patient performance of the model we utilise a 5-fold cross-validation split of the data on an assessment level, stratified by the patient’s disease severity. This way, all videos from a single assessment appear in only one of the cross-validation folds, ensuring that the model is not trained and tested using the same patient data.
To test the model’s ability to generalise to unseen assessment environments, data from a single site, namely TSL, have been held out of the cross-validation setup for cross-site performance comparison. The distribution of assessments across sites is shown in Table II. Furthermore, data on patient characteristics have been available for 620 out of 1170 assessments. A summary of the information is presented in Table III.
Region of interest. Along with the MDS-UPDRS item label, the dataset contains a human-annotated region of interest (ROI) for each activity in the video. The ROI specifies the interval of frames within which an item-specific activity took place. Combining the ROI annotation with the activity label enables frame-level prediction training, where each frame within the specified range is considered as belonging to the target activity class. Frames outside the annotated region are assigned the No Action label.
Data collection. The video assessments used for this work were collected using consumer-grade handheld devices with an installation of KELVIN™, a clinical tool that has been adopted in line with the respective procedures of each institution. No specific requirements regarding the distance of the camera to the subject were imposed during data collection. Informed consent was obtained from all subjects and the agreements formed with each institution allow for the data to be used in this context. A subset of the data has been collected as part of clinical trials: Exenatide for Parkinson’s Disease (EXENATIDE-PD, NCT01971242), Antidepressants Trial in Parkinson’s Disease (ADepT-PD, NCT03652870) and The Motor Network in Parkinson’s Disease and Dystonia: Mechanisms of Therapy (NCT03582891).
Pose estimation processing. Prior to activity classification, 2D coordinates of estimated body joint locations were extracted from every frame in each video using a markerless deep-learning pose estimation library OpenPose.25 The framework is integrated as part of the KELVIN™ platform. Pixel coordinates and estimation confidence scores for 25 body key points and 10 hand key points (fingertips) have been selected to capture poses and movements characteristic to the predicted tasks.
Model
Spatio-temporal pose graph. Instead of treating each key-point independently, the model views the input as a spatio-temporal graph representing the evolution of the estimated body pose. Key-point locations correspond to the graph vertices and are connected by two sets of edges: (1) spatial and (2) temporal. The spatial edges connect joints within each frame, according to the anatomical construction of the human skeleton. The temporal edges connect corresponding joints in neighbouring frames. A simplified representation of a spatio-temporal pose graph has been depicted in Fig. 1(B).
Network architecture. The model architecture is based on the ST-GCN model introduced by Yan et al.14 It consists of 10 graph convolution layers operating in both spatial and temporal dimensions, followed by a final prediction convolution layer. Compared to common convolution neural networks (CNNs) where the convolution window slides over a well-defined grid-structured input, graph convolution networks (GCNs) perform the calculation on a graph-based input instead.
Given a series of poses, the original model outputs a single action prediction vector of size (C), where C is the number of target classes. It makes use of strided temporal convolutions and a global averaging layer. Increasing the stride of temporal convolutions increases the receptive field of successive layers and allows the model to capture features of predicted activity spanning a broader time window. The global averaging layer allows video-level action prediction for image sequences of arbitrary length.
The model structure has been augmented to predict the performed action on a frame level, outputting a prediction vector of shape (T, C). To preserve the size of the input’s time dimension T, the stride values in all temporal convolution layers have been set to 1, and the time averaging step has been omitted.
Training setup
Data sampling. Each input video captures a single MDS-UPDRS item and may contain up to two ROI annotations (one for each lateral activity). To prevent the model from learning order dependencies between action classes (for example, right-hand movements are generally followed by left-hand movements), the input for double-labelled items is split between the two ROI annotations during training.
Manual ROI labellers were instructed to label only one example of an activity class in each video. To avoid presenting the model with a No Action label for non-annotated regions of true activity, for training, we cut the input to a maximum of 45 frames outside either end of the annotated ROI. To offset the loss of true No Action regions further away from the ROI, we reverse the remaining 45-frame segments of No Action and append them to the ends of the input. For validation and testing no cutting has been applied.
The duration of PD assessment can vary considerably within and between activity classes. Considering the frame-level prediction setup we leverage the fully convolutional model architecture and view each input as a set of T examples and randomly sample a fixed number of consecutive frames (sampling window) from the processed videos to accommodate input length differences for batch training. We have chosen a sampling window of 150 frames and a batch size of 16. Model validation and testing have been performed without subsampling.
Data augmentation. During training, the sampled pose sequences were randomly augmented using four transformations: shift, rotation, scaling and horizontal flip; designed to simulate varying camera placements. Moreover, flipping the pose horizontally allowed for left-lateral movements to be considered as right-lateral activity examples and vice versa. Additionally, out-of-frame masking was randomly applied to chosen classes, removing pose information from lower or upper parts of the video, for upper- and lower-body activity classes respectively.
Training. The models have been trained using the common cross-entropy loss. Target labels have been augmented according to a smoothing strategy introduced by Szegedy et al.29 To prevent the model from becoming too confident in a single prediction and overfitting to the training data, the true binary frame label is smoothed using a parameter ε set to 0.1, as per the original implementation.
The training gradient descent has been performed using the Adam30 optimiser with an initial learning rate of 0.01. A maximum number of training epochs has been set to 100. The adjustment of the learning rate during training has been guided by a linear scheduler, which monitored a validation set loss and decreased the learning rate by a factor of 3 if no validation score improvement has been recorded for 5 consecutive epochs. Model training has been distributed using AWS batch service over GPU-enabled (NVIDIA V100) compute instances.
Post-processing and ROI prediction
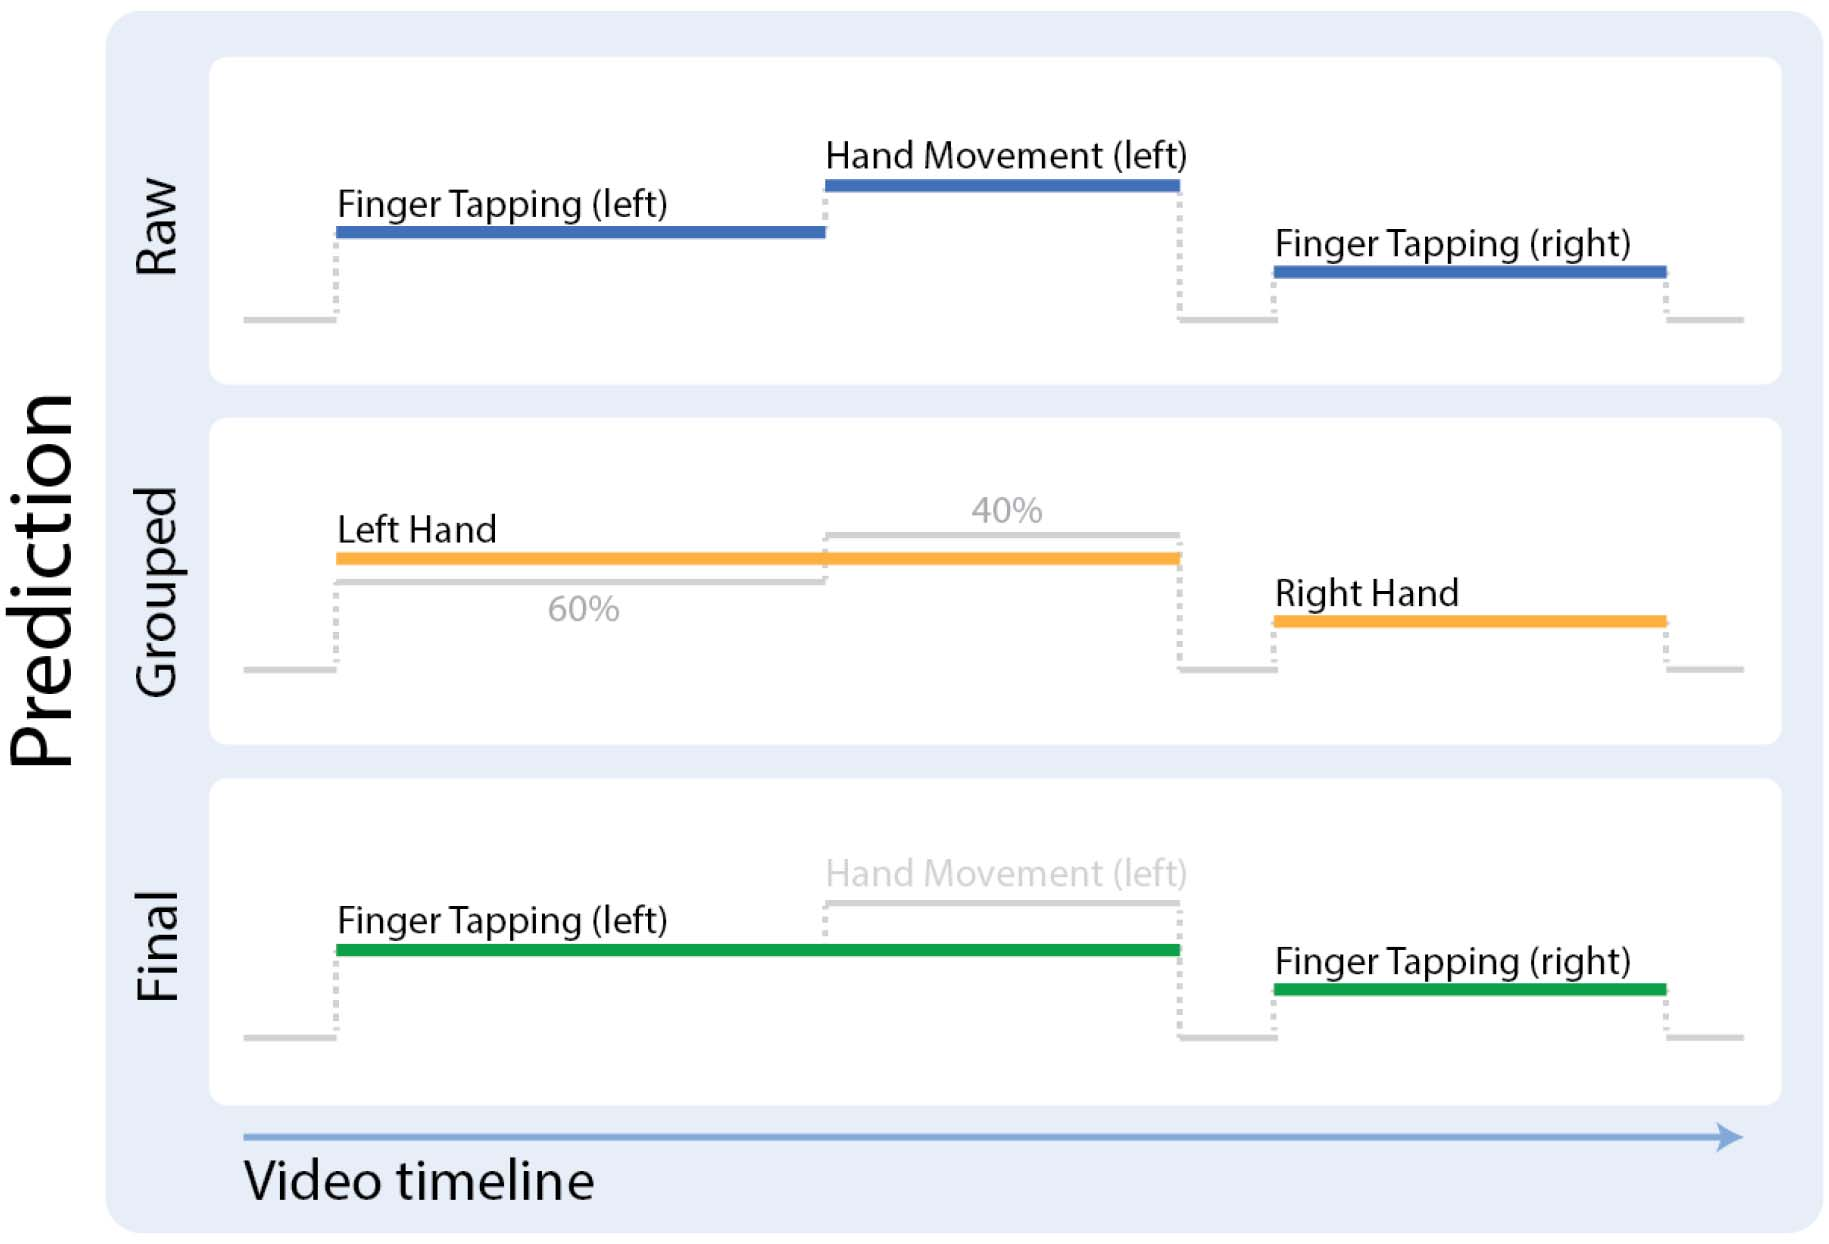
One of the objectives of the framework is to accurately annotate the region of a patient’s activity. As the activity prediction is performed on a frame-by-frame basis, the connectivity of outputted single-class regions may be affected by factors such as noise present in pose estimation data. To counter confusion between classes sharing similar poses and movement patterns, for example left hand FT and left hand HM, the frame-level output is processed by first finding connected regions of limb-grouped activities, and then assigning the final class label to each region according to the majority vote of the constituting frames. The process is visualised in Fig. 2. Since the human-annotated ROIs specify only one region of distinct activity per video, the longest connected region of each predicted activity class is considered the final model annotation.
Evaluation
Video-level classification. In the video-level setup, given a series of poses from a single video, the model has to identify the corresponding MDS-UPDRS task being performed by the patient. Model performance is evaluated using two metrics: balanced accuracy, prediction accuracy averaged across MDS-UPDRS items; and top-3 accuracy, where the target class is among the top 3 most confident predictions.
We compare the ST-GCN’s performance with two “shallow” machine learning models: KUPDRS,10,11,12 originally developed for PD severity estimation, which extracts MDS-UPDRS item-specific signals and features and performs the prediction using a random forest classifier and has been adopted here to perform activity recognition instead of severity estimation; and Cov3DJ,31 which constructs a key-point covariance-based descriptor to characterise pose movements throughout the video, classified using a linear SVM model.
ROI prediction. Predicting the activity on a frame-by-frame basis allows the model to localise and classify regions of patient activity within an assessment video. We choose a popular segmentation accuracy measure, the intersection over union (IOU), as the primary metric to evaluate the correspondence of human- and model-provided ROI annotations. The IOU score specifies the quality of overlap between two activity region annotations. It has been calculated for all labelled regions of patient activity.
Annotation agreement comparison. To analyse the level of agreement between different human annotations and compare them to the model-predicted ROI, 80 videos (10 videos per predicted MDS-UPDRS item), not found in the main dataset and without an existing ROI annotation, have been selected and independently annotated by three human labellers.
For each such video, we construct a “robust” label by combining two human annotations. Given 3 possible pairings of human labellers, we obtain 3 such annotations. Each “robust” annotation consists of 3 regions: (1) the overlap of two ROI annotations, (2) segments covered by only one of the ROI annotations, and (3) frames covered by neither ROI annotation. Regions 1 and 3 are considered “robust” annotations of activity and No Action regions respectively and form the video ground-truth label. Region 2 is regarded as an area of human disagreement and is excluded from evaluation.
We then compute the IOU score for all “robust” labels, once using the model prediction, and once based on the remaining human annotation (one that has not been used to construct the “robust” label). We compare the scores to see whether the model- and human-predicted activity regions differ significantly in the presence of inter-labeller variability.
Disease severity estimation. For every video in the dataset, there exists a set of corresponding PD severity scores assigned by expert clinicians according to the MDS-UPDRS manual. Previous work has shown that machine-learning models can analyse PD assessment videos within manually annotated ROIs of patient activity through the extraction of kinetic signals and features, and yield estimates of the motor impairment severity.10,11,12,32 To test the adequacy of using model-predicted ROIs for PD severity inference, we cross-validate the severity-estimation models trained with human-annotated ROI data and compare test-fold prediction accuracy based on both human- and model-annotated ROIs.
Results
Video-level classification
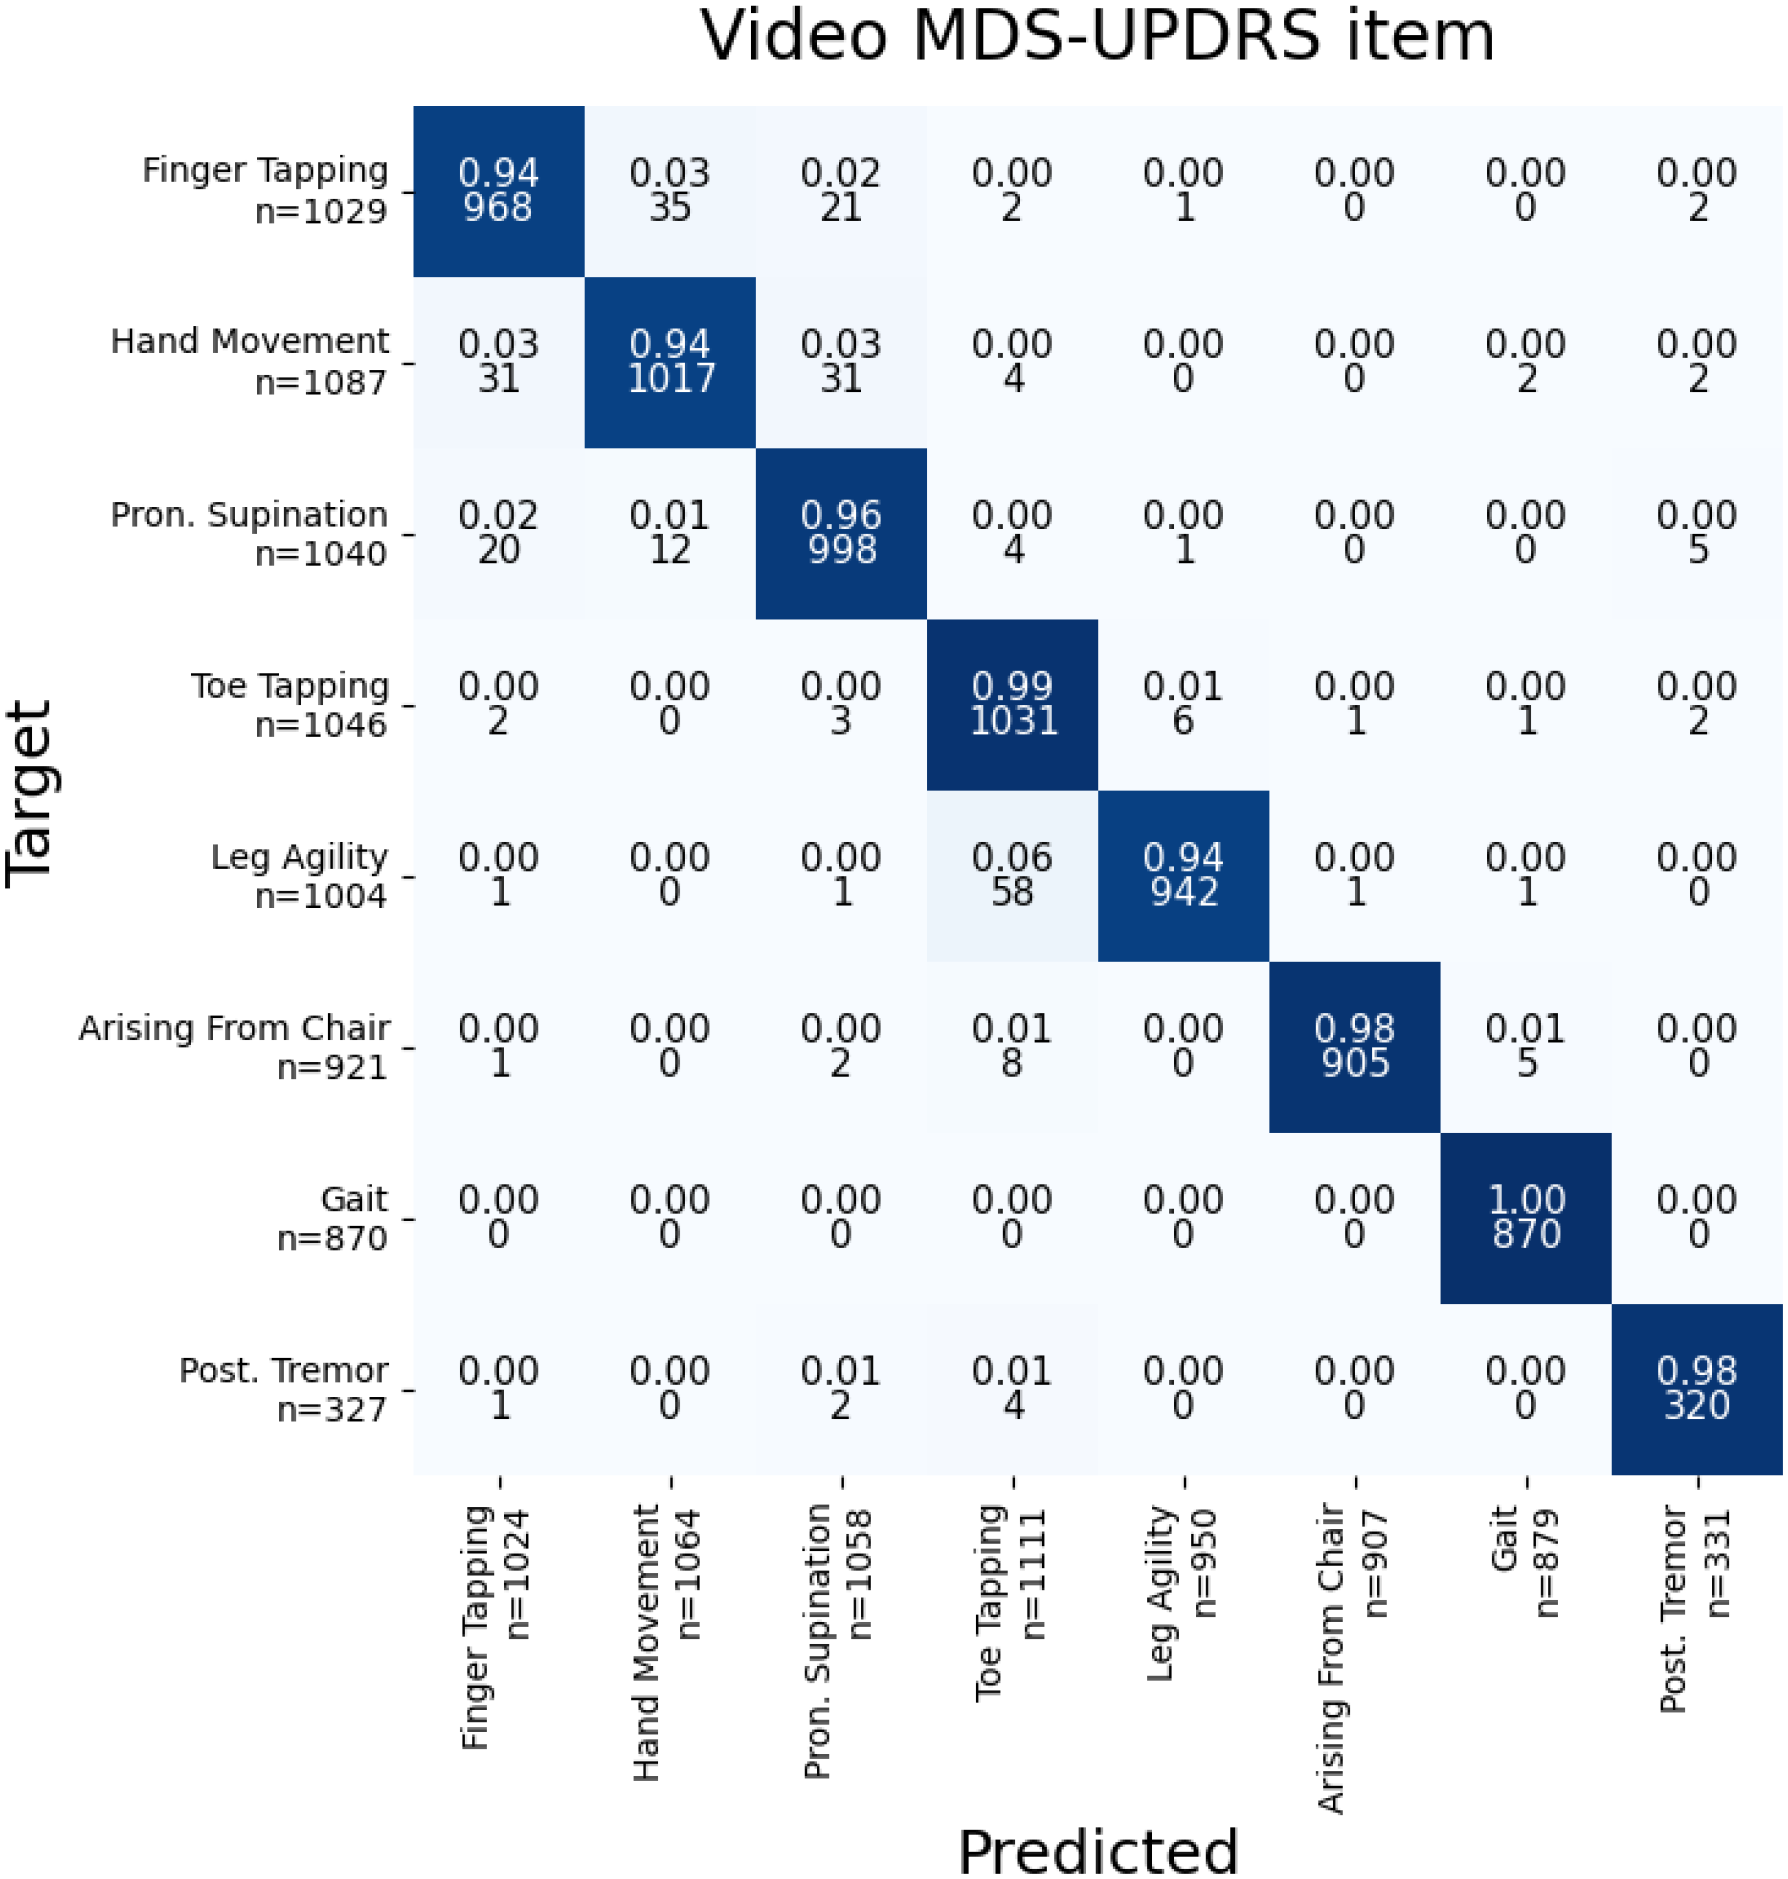
The confusion matrix for video-level activity classification is shown in Fig. 3. The trained model achieves a mean cross-validation accuracy score of 96.51% balanced across predicted MDS-UPDRS items. Noticeable confusion occurs between items sharing similar movement patterns and poses: hand-items including FT, HM and PS; as well as leg-items TT and LA.
Cross-validation and held-out site performance comparison of the deep learning framework with two “shallow” machine learning models for video-level activity classification is shown in Table IV. Although the traditional machine learning models have indicated the ability to discriminate between the target classes in most cases, the deep learning model significantly outperforms both alternatives.
The held-out test site performance decreases compared to the cross-validation result for all models, suggesting the methods might not generalise as well to unseen assessment settings. Further inspection of the results revealed the KUPDRS model can be sensitive to patients not being fully in-frame, which leads to the omission of samples. Recalculation of ST-GCN held-out site scores excluding samples discarded by the KUPDRS model yields 95.19% balanced accuracy and 99.39% top-3 accuracy scores, almost matching the cross-validation data performance.
ROI prediction
Compared to human annotators, the model has no prior knowledge of the motor assessment item being captured in the video and can misclassify the identified activity ROI. Misclassification of a correctly localised region of activity will result in a zero IOU score. Similarly, if the longest-connected region of the target activity (chosen as the final model ROI prediction) has been unlabelled, the metric score will again be 0. Mean IOU scores, both including and excluding misclassified or mislocalised model ROIs, have been reported in Table V.
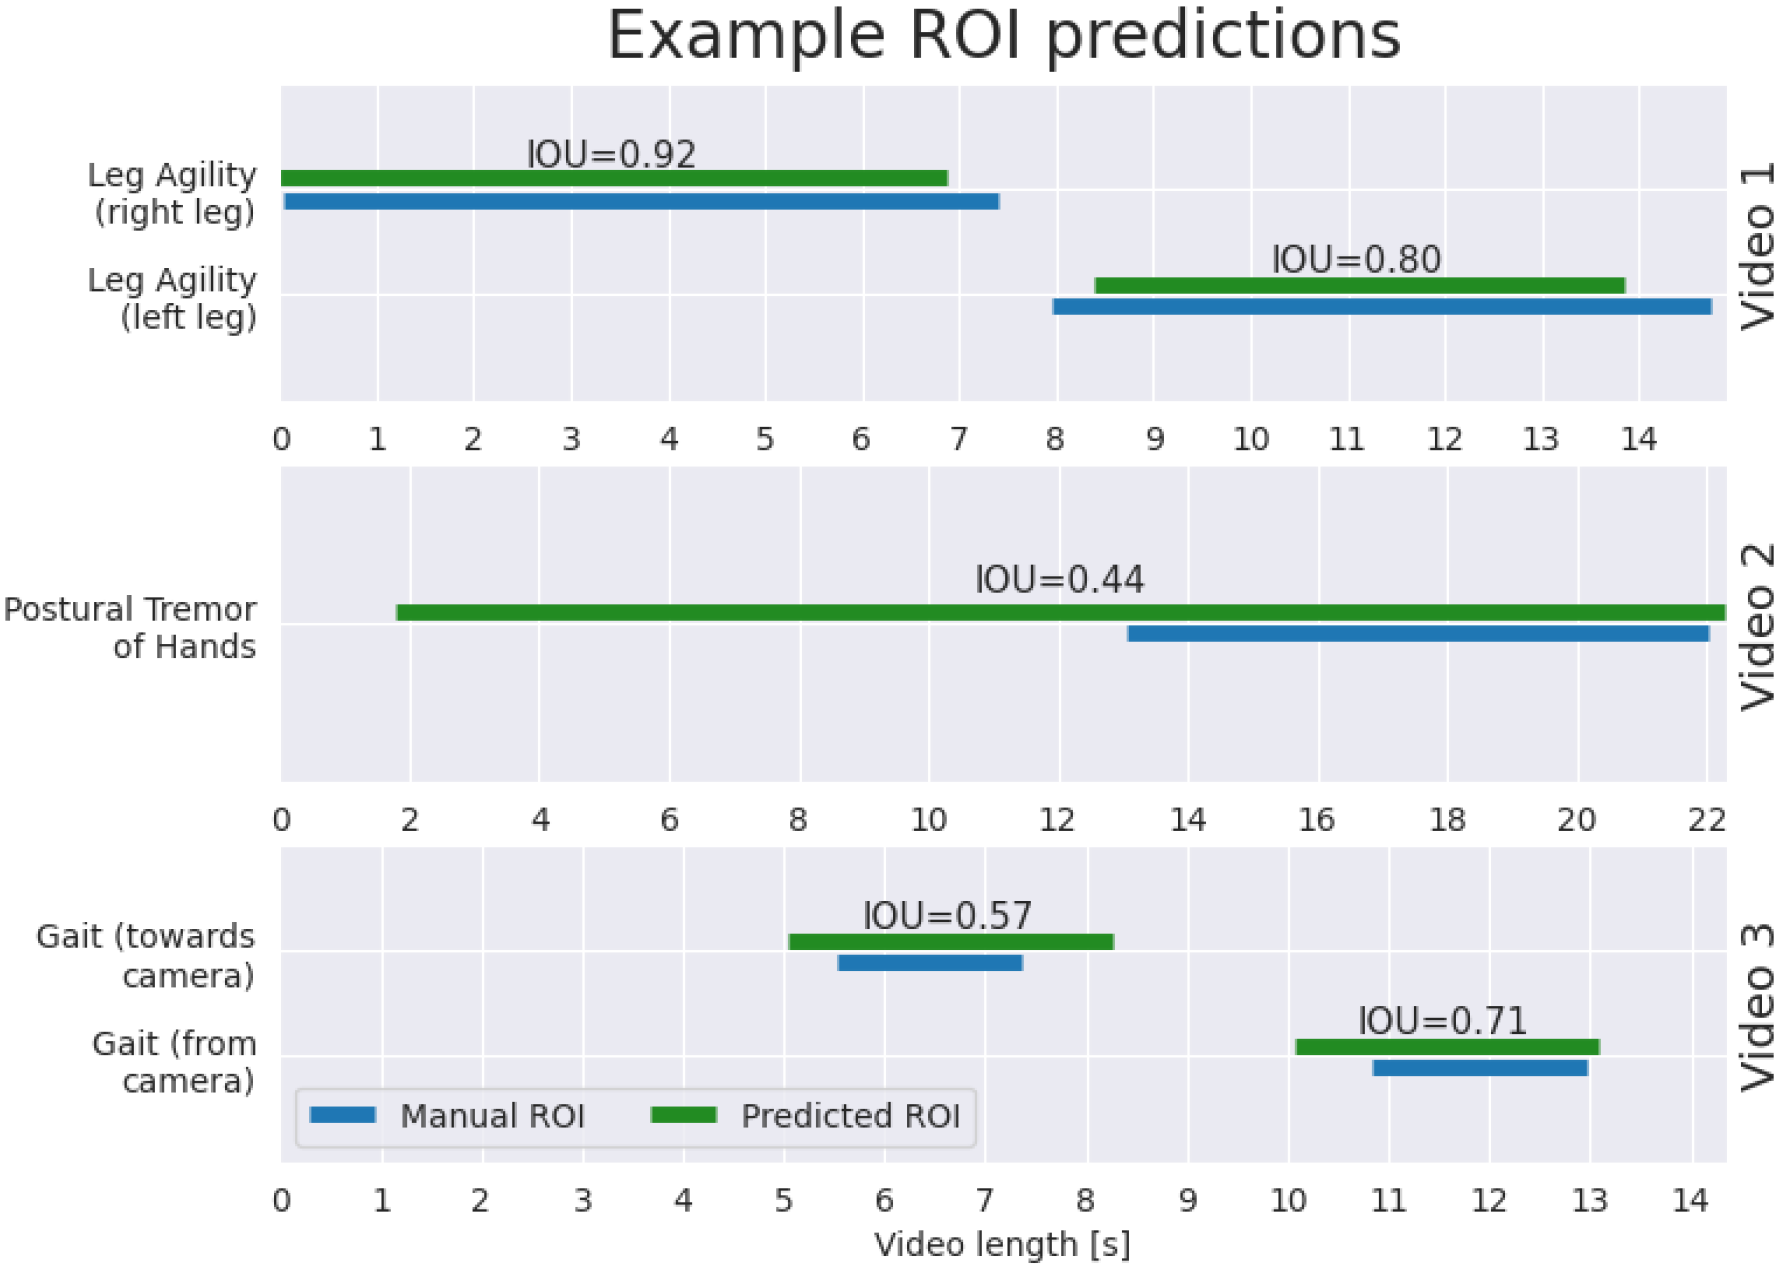
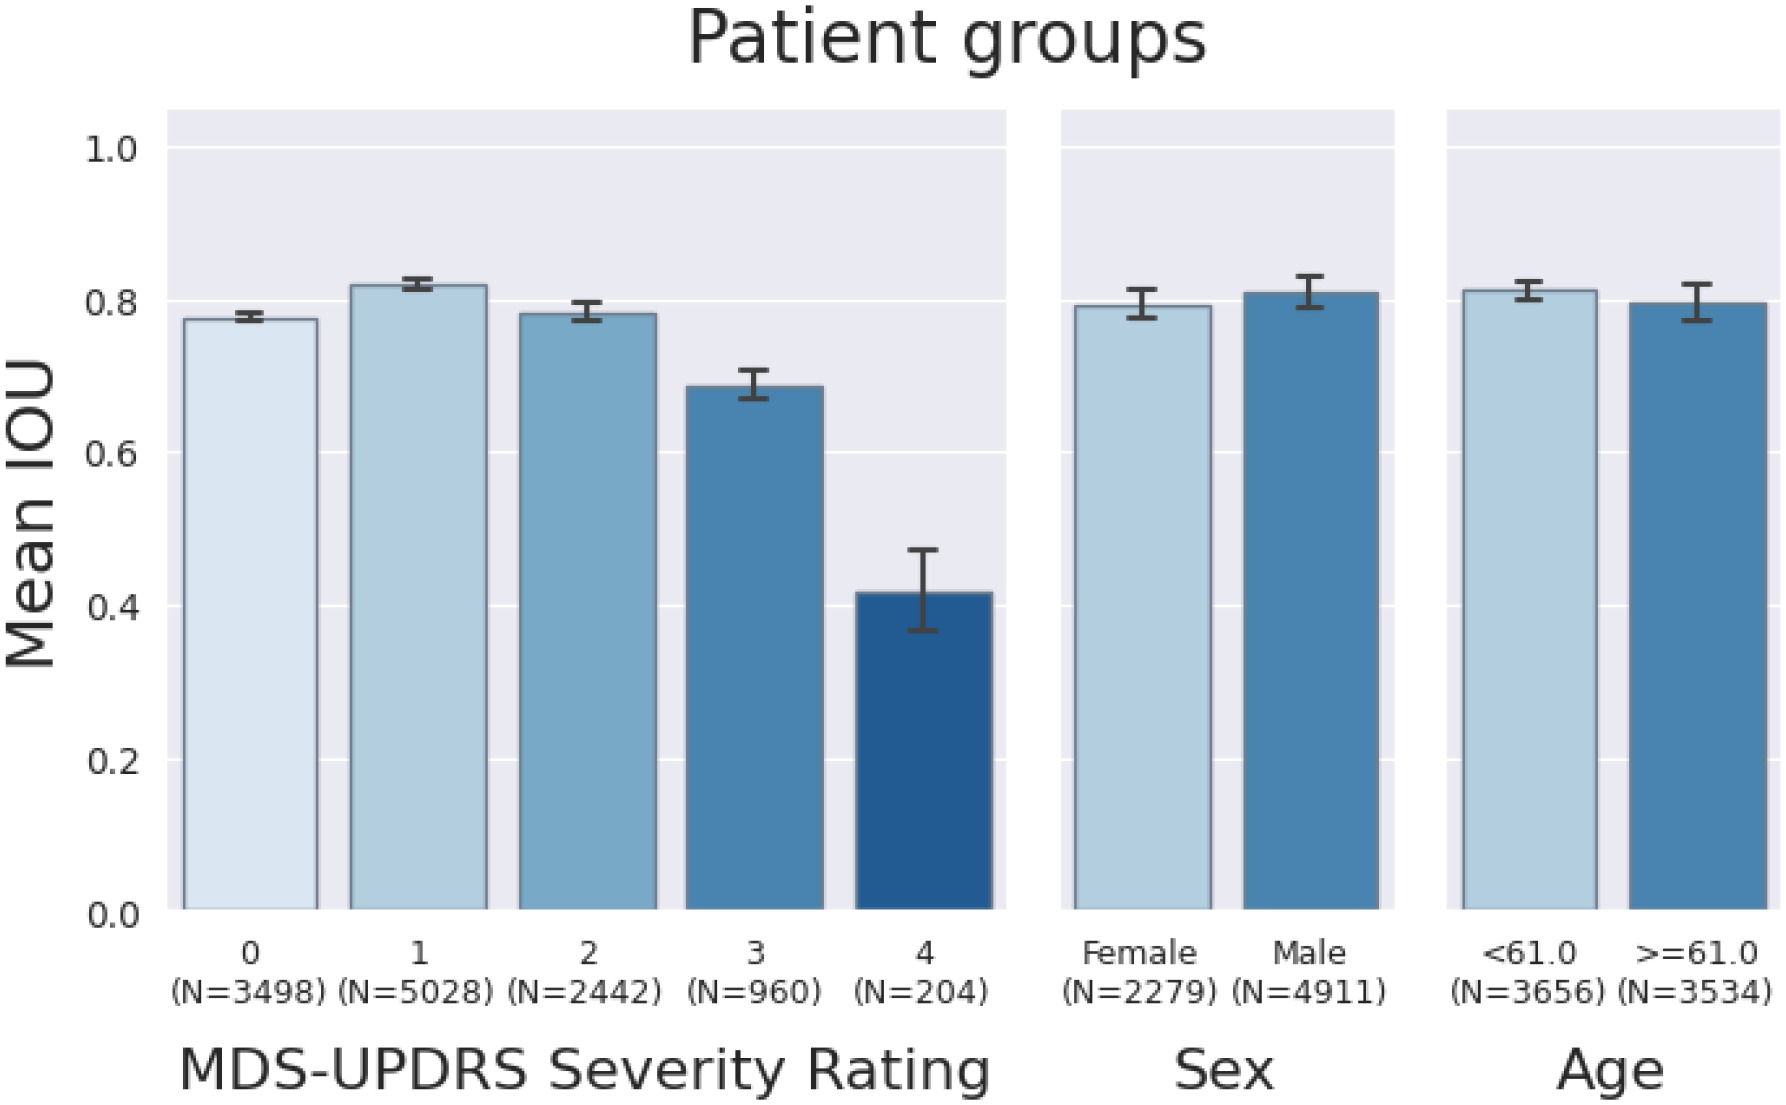
For correctly localised and classified regions of activity (the predicted region overlaps with the labelled one), the mean IOU score across most of the activity classes exceeds 0.8. Examples of model-annotated regions of activity together with corresponding IOU scores are visualised in Fig. 4. The cross-validation results broken down by disease severity, sex and age are shown in Fig. 5.
The misclassification rate for hand and leg-related items is around 5%, which corresponds to the video-level confusion for these tasks. For Gait, patients often perform the task twice, repeating the walk towards and away from the camera. Choice of the unlabelled Gait ROI contributes to its mislocalisation rate. Although Postural Tremor of Hands has been well-identified on the video level, many of the predicted regions do not overlap with the human annotation. PT assessment can vary between sites, which can cause divergence in human labelling and negatively impact model training and evaluation. For overlapping predictions, however, the IOU score matches that of other activity classes.
Although most of the items have shown no significant decrease in performance for the held-out site, notable differences can be seen for leg-related activities and Arising from Chair. Substantially different camera placements or failure to capture the entire patient in the frame can negatively affect the connectivity of the predicted activity region. The result highlights the importance of data capture standardisation.
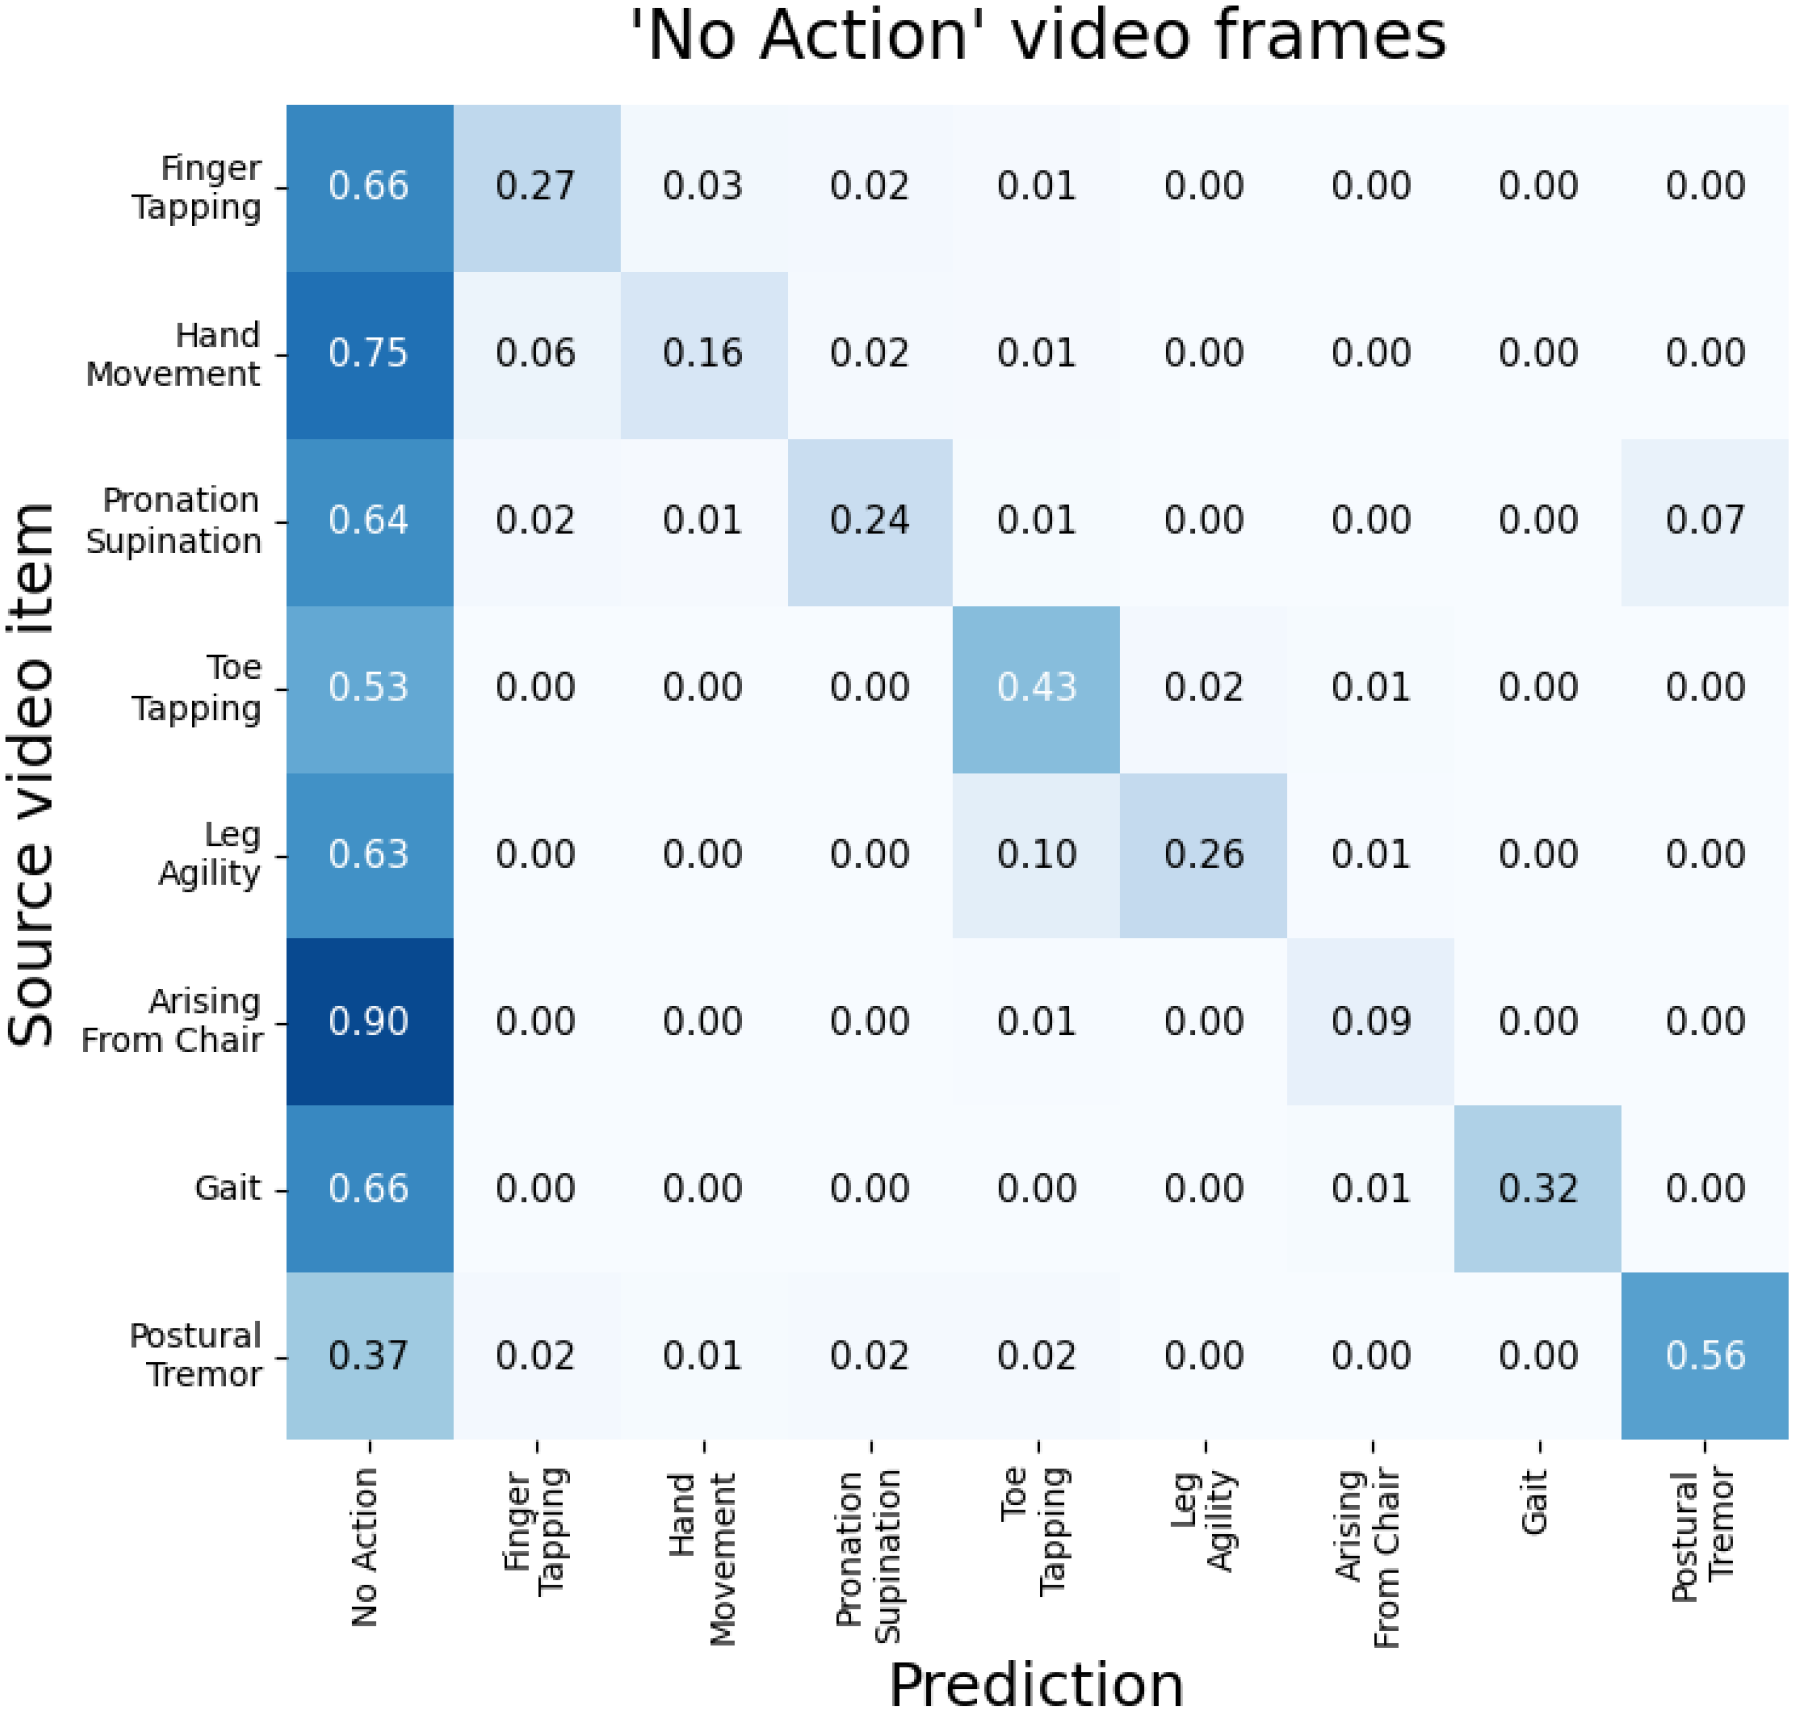
The confusion for No Action frames grouped by MDS-UPDRS items is shown in Fig. 6. The regions of No Action are mostly confused with the corresponding video item label, despite the similarity of No Action poses between classes such as sitting down for all hand- and leg-items. This may suggest that the ground-truth ROIs occasionally cover only a subsection of the intervals during which the relevant activity was being performed, or the video contains an additional, unlabelled region of the target activity.
Multi-item video stream
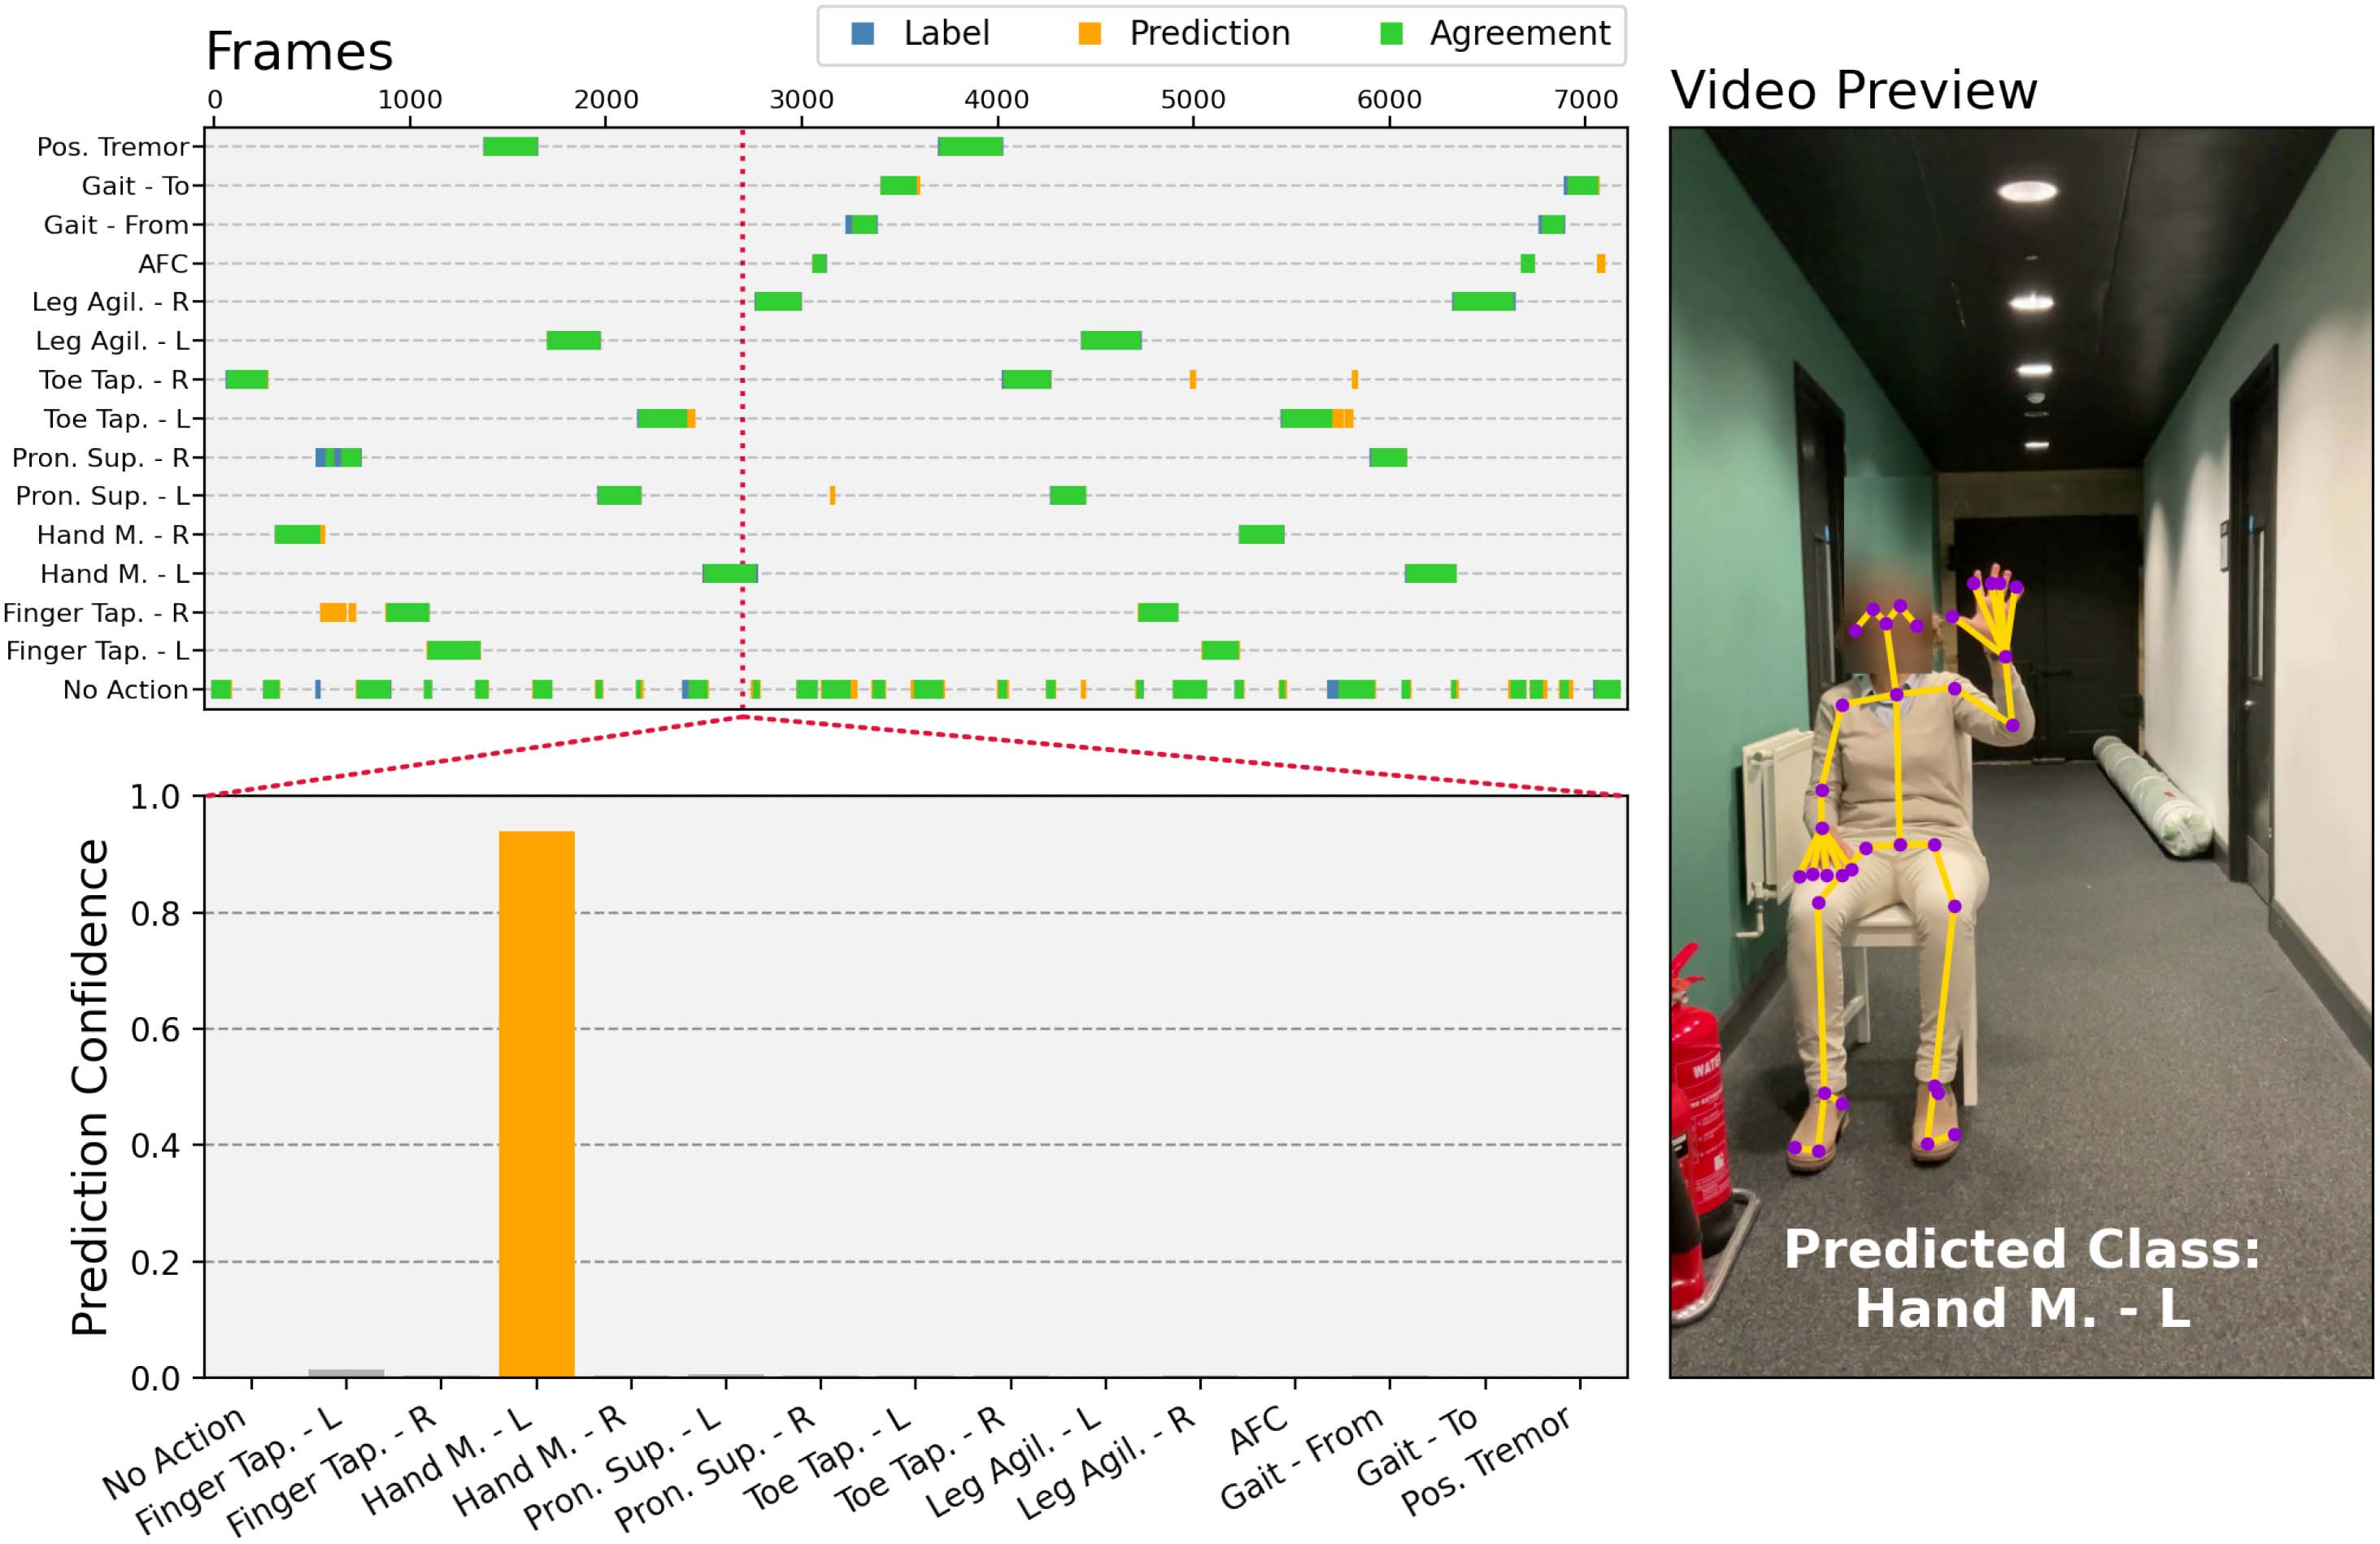
One of the benefits of a frame-by-frame activity prediction setup is the ability to process video inputs of arbitrary length and automatically annotate and classify multiple regions of patient activity. To validate the model’s capability of continuous, multi-item activity recognition, a single video of a subject performing MDS-UPDRS specified activities in a randomised order has been recorded and processed by the proposed framework. As shown by Fig. 9, the model has identified all regions of human activity and correctly classified 91.8% of all frames labelled by a human annotator.
Annotation agreement comparison
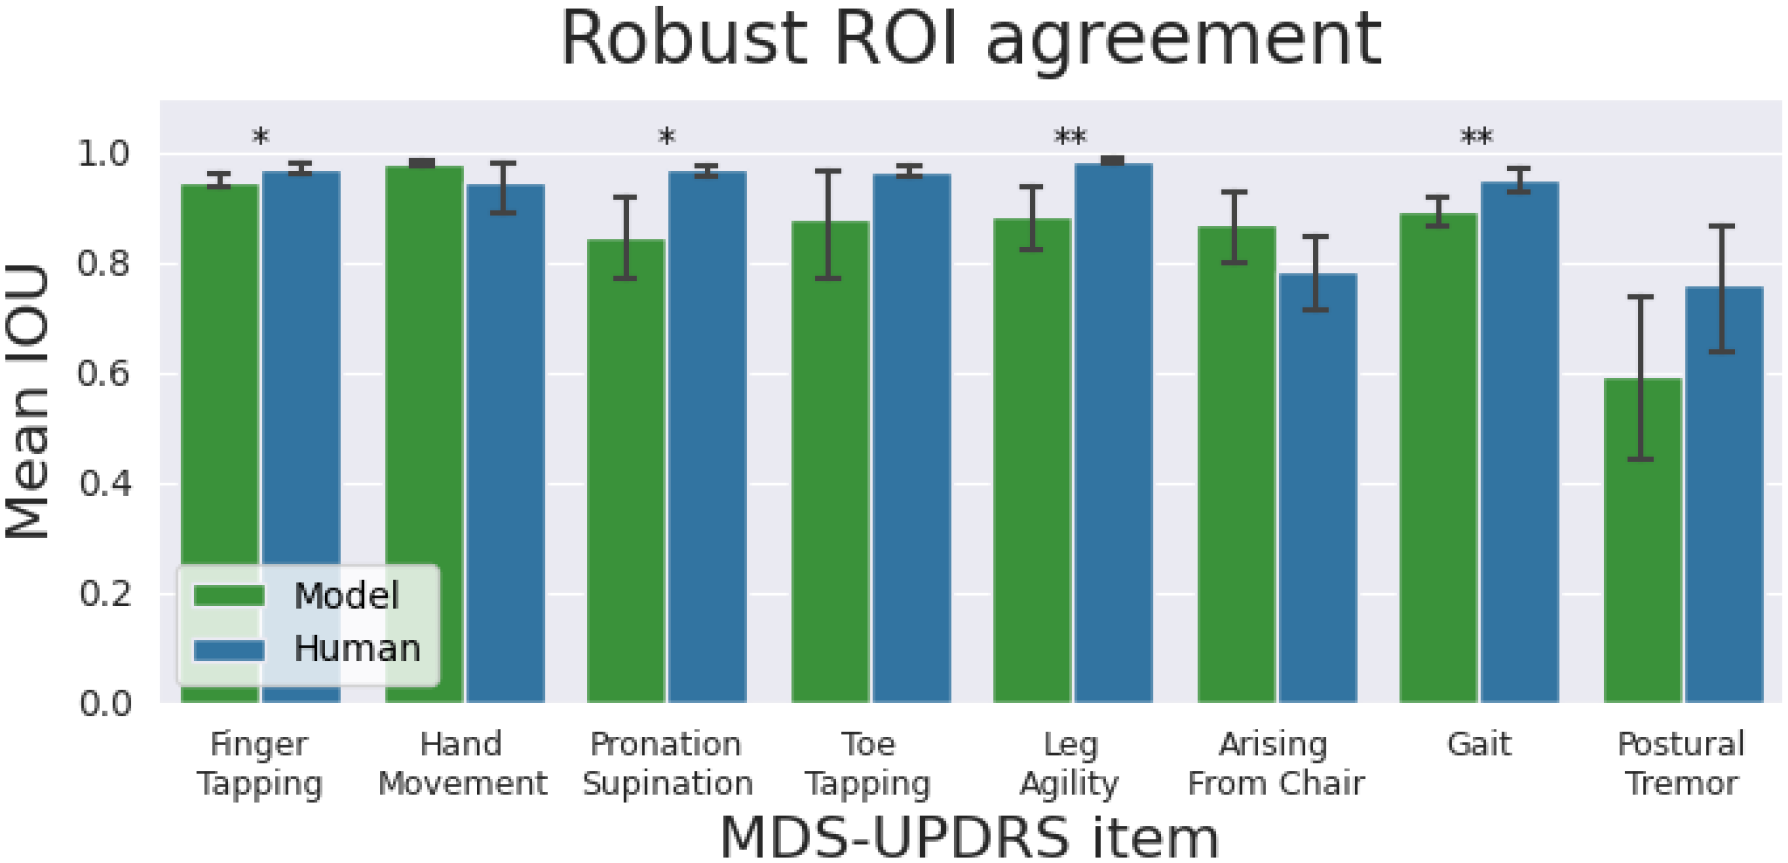
Comparison of mean IOU for each predicted MDS-UPDRS item under robust ROI labels, for human annotations and model predictions, has been shown in Fig. 7. The model, in general, performs on par with human annotators. Despite the statistically significant differences in mean IOUs between human and model video annotations, the magnitudes may be considered negligible.
For Pronation Supination and Leg Agility, the significant difference in reported TPR arises due to the model identifying the wrong class, while still accurately identifying the activity region. This happens in 1–2 videos of these items. For Gait, the decrease in performance may be caused, in part at least, by noise present in pose estimates when patients are far from the camera. The difficulty of consistent PT and AFC activity annotation is shown by relatively low human-to-human agreement, which coincides with previous results.
Disease severity estimation
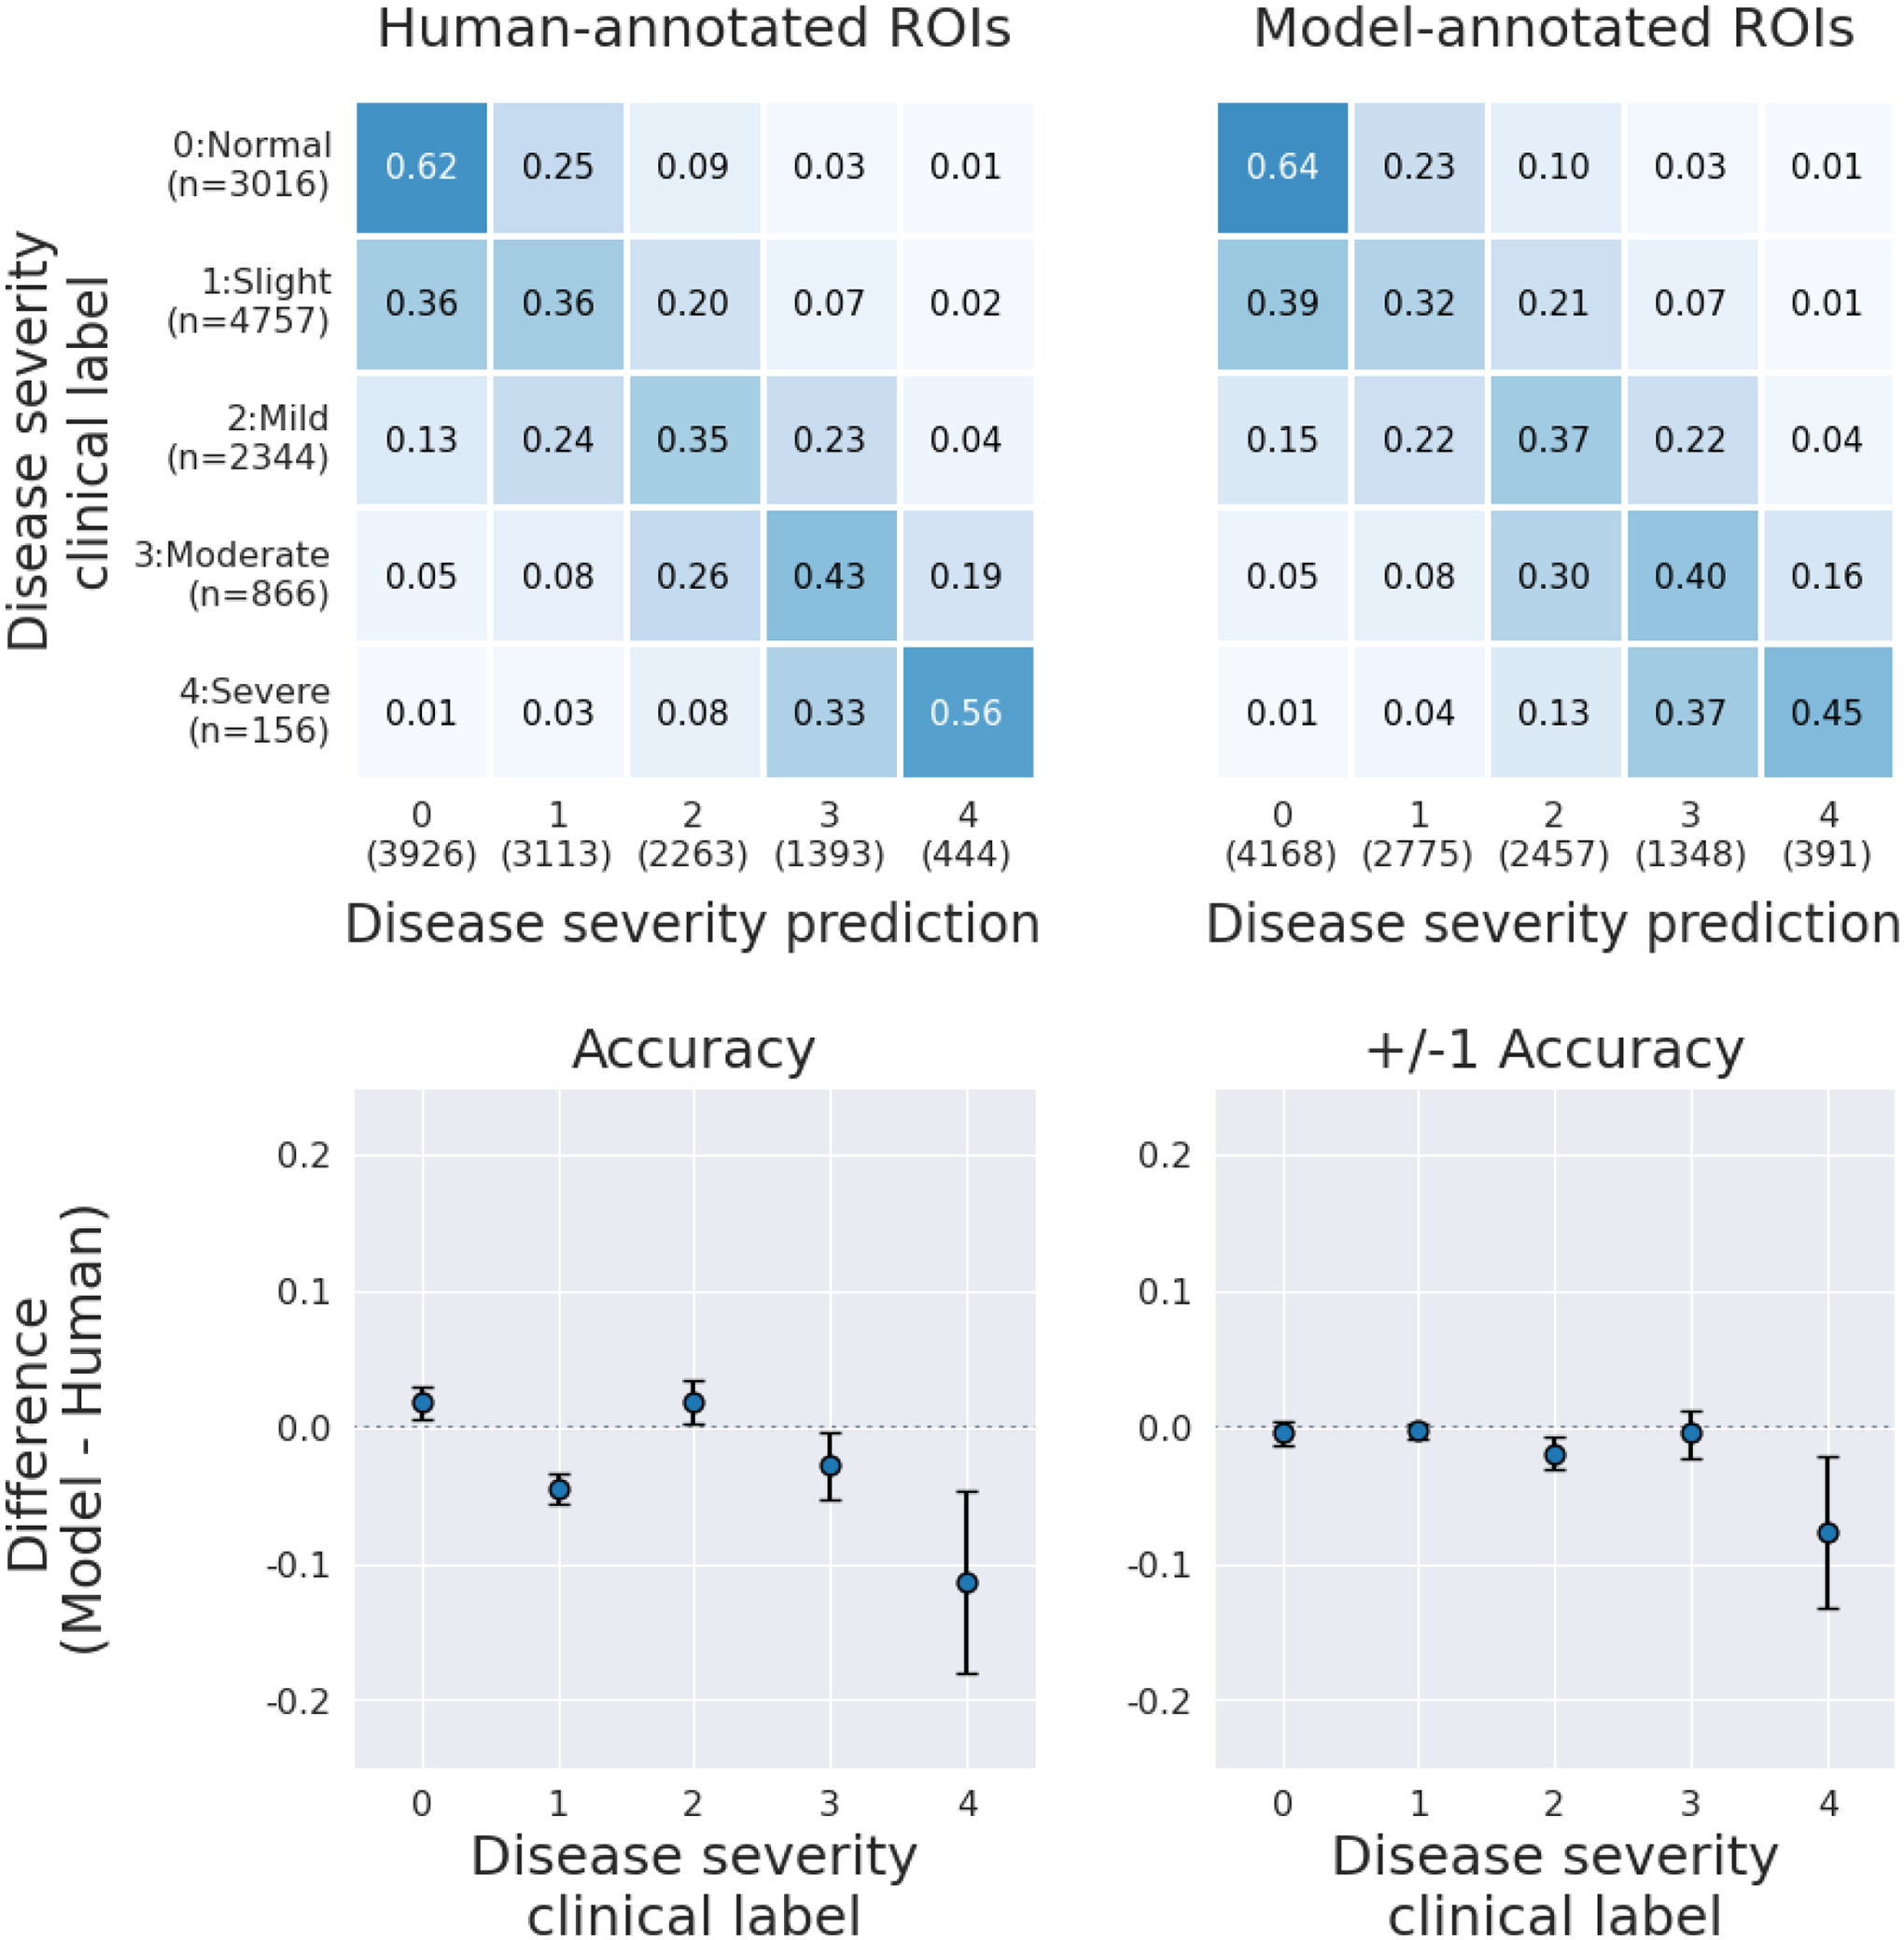
Severity-estimation model results based on human and model ROI annotations are presented in Fig. 8. Model annotated ROIs cause no systematic decrease in SE model performance for severity scores lower or equal to 3. In particular, acceptable accuracy, or +/−1 accuracy (i.e. prediction error within 1 point on the MDS-UPDRS scale), shows no clinically nor statistically significant change. As previously shown in Fig. 5, the ROI prediction accuracy decreases for the highest-severity patients. The model might fail to recognise when the patient intends but is unable to perform the activity, which consequently would bias the severity estimate towards lower scores, as we limit the input to “active” regions only.
Discussion
Summary of result
We developed a vision-based HAR framework capable of dynamically classifying motor assessment tasks performed by Parkinson’s disease patients. A deep learning model, utilising the estimated body joint locations of the patient as input, was trained to distinguish between 8 MDS-UPDRS items and corresponding 15 activity classes. The model achieves 96.51% balanced accuracy in video-level activity classification and outputs highly accurate annotations at a frame-by-frame temporal resolution.
We have additionally shown how our method generalises to new patient data, recorded at settings not seen during training, displaying comparable performance on data collected at a held-out site for most of the predicted activities.
By comparing mean inter-human and human-model differences in the annotation of patient activity regions, we demonstrated a close correspondence between human and model activity labelling. Finally, using model-annotated regions of interest for algorithmic disease severity estimation yielded similar performance, potentially obviating the need for (previously required) human labelling.
Limitations and future work
While in most cases the model is able to provide a continuous region of correct activity class prediction, areas of prominent confusion have been identified. Further work will be undertaken to improve the activity recognition accuracy for classes sharing similar movement patterns and body poses. Exploration of extensions and alternatives to the presented framework inspired by advances in general HAR modelling will be a part of future research endeavours. This may entail the addition of higher-order pose information including inter-frame key-point velocity or acceleration.
Considering the effect of inconsistent ROI labelling on frame-level-based activity prediction training, a model-assisted relabelling effort may be justified. Additionally, techniques such as self-distillation may be used to offset the negative impact of noisy labels.
The presented activity recognition pipeline has been developed using cloud servers. However, many practical applications will require real-time local computation that is deployable on commercially available mobile device hardware. Future development efforts may therefore focus on mobile device implementation.
Practical applications
Combined with disease severity estimation models,10,11,12 this HAR framework is a crucial element in achieving remote, asynchronous PD motor assessment at scale. Potential applications include, but are not limited to, massive remote clinical trials, closed-loop and patient-driven programming of both invasive and non-invasive neuromodulation devices, and the general medical management of patients.
Figures
Tables
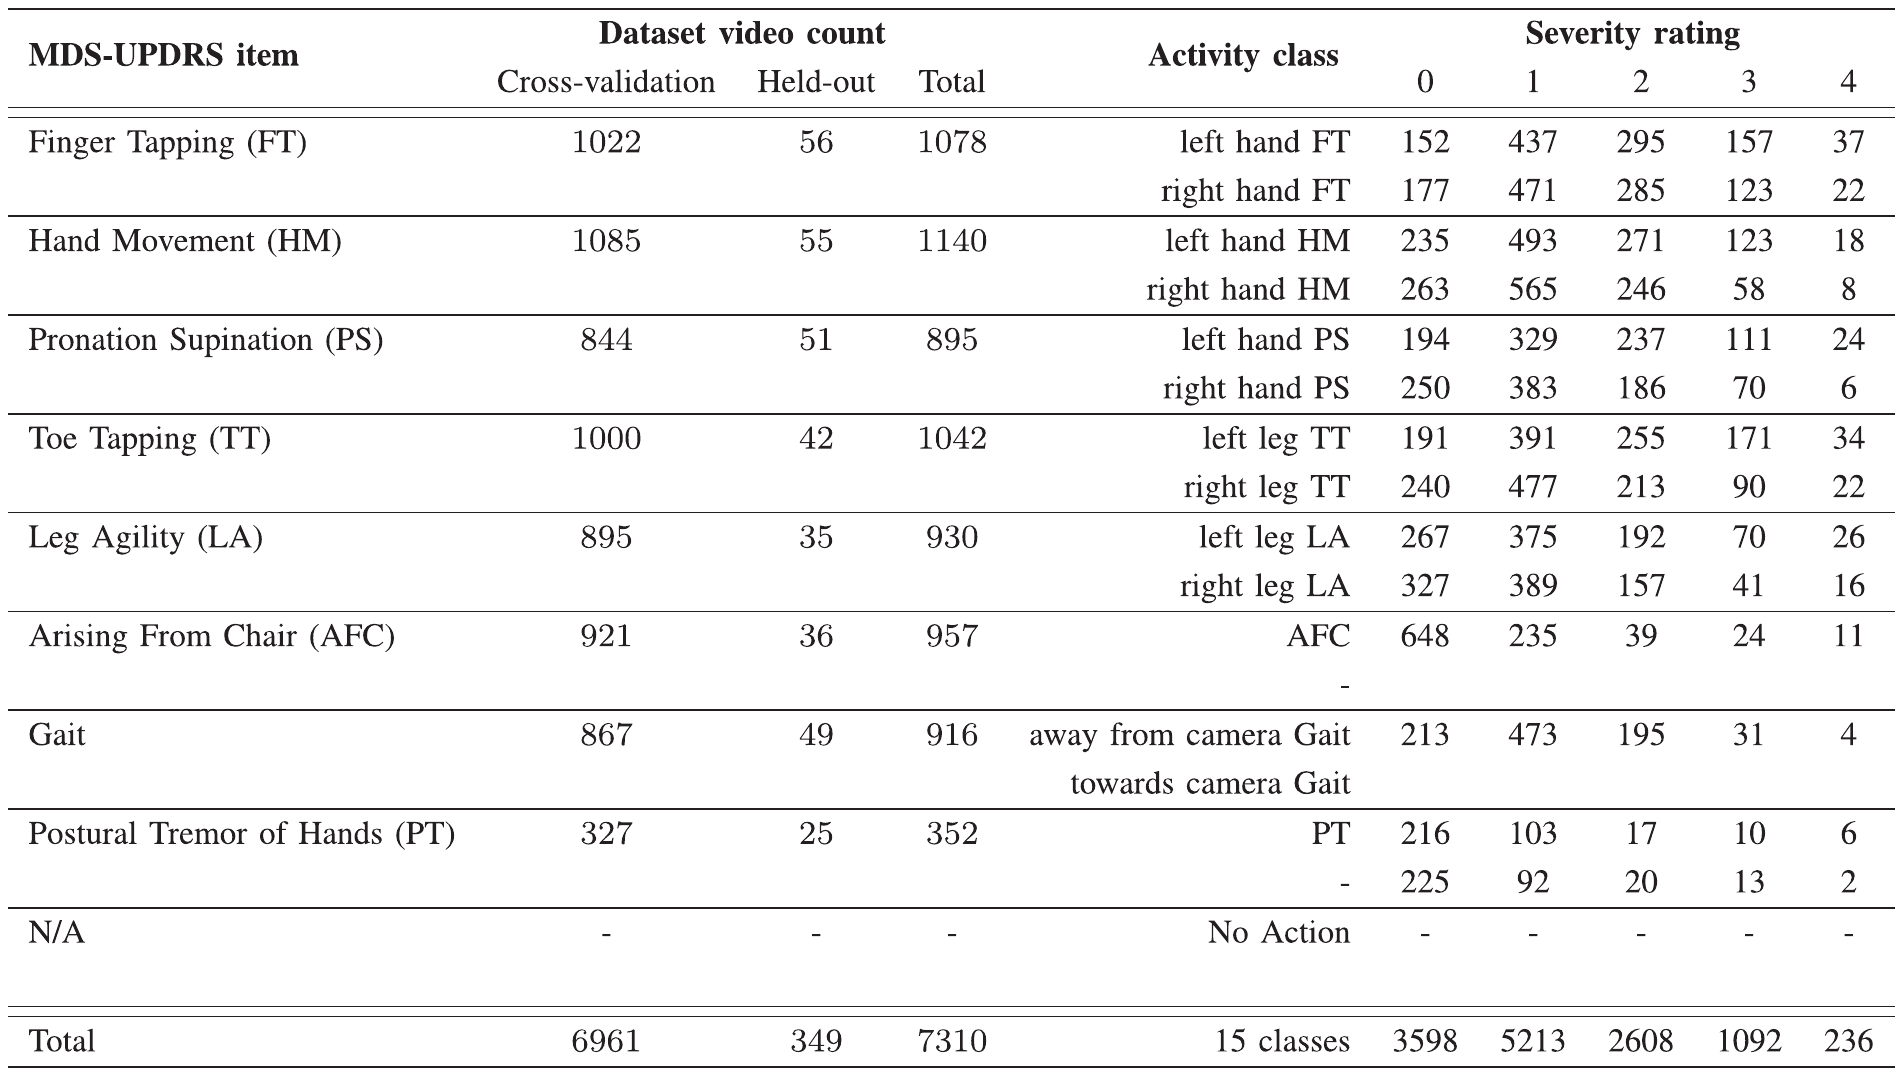
Table I. Video and Severity Rating Counts by MDS-UPDRS Item Class. For some items, two activities can be distinguished, which is reflected in the activity class labels. The cumulative distribution of clinical MDS-UPDRS severity ratings exhibits a strong positive skew with a mode rating of 1.↑
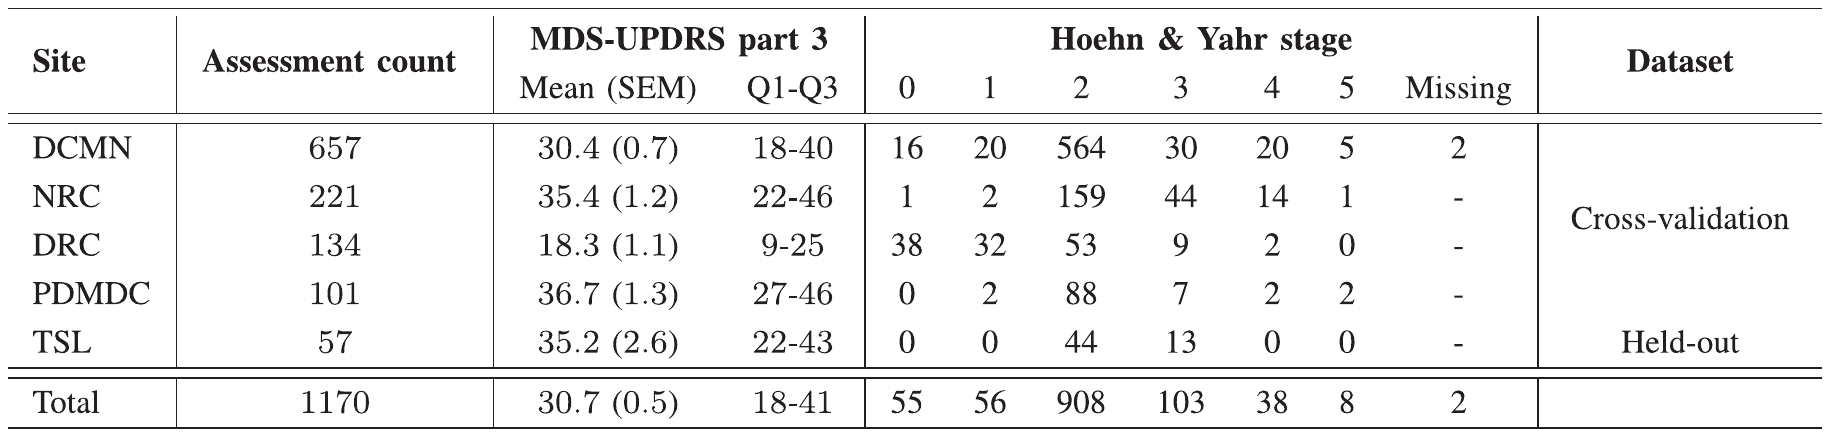
Table II. Site Distribution. Model cross-validation has been conducted using data from 4 assessment sites. The remaining site, TSL, has been held out of the cross-validation setup to test the model’s ability to generalise to unseen environments. In total, the dataset comprises 1170 MDS-UPDRS part-3 motor assessments.↑
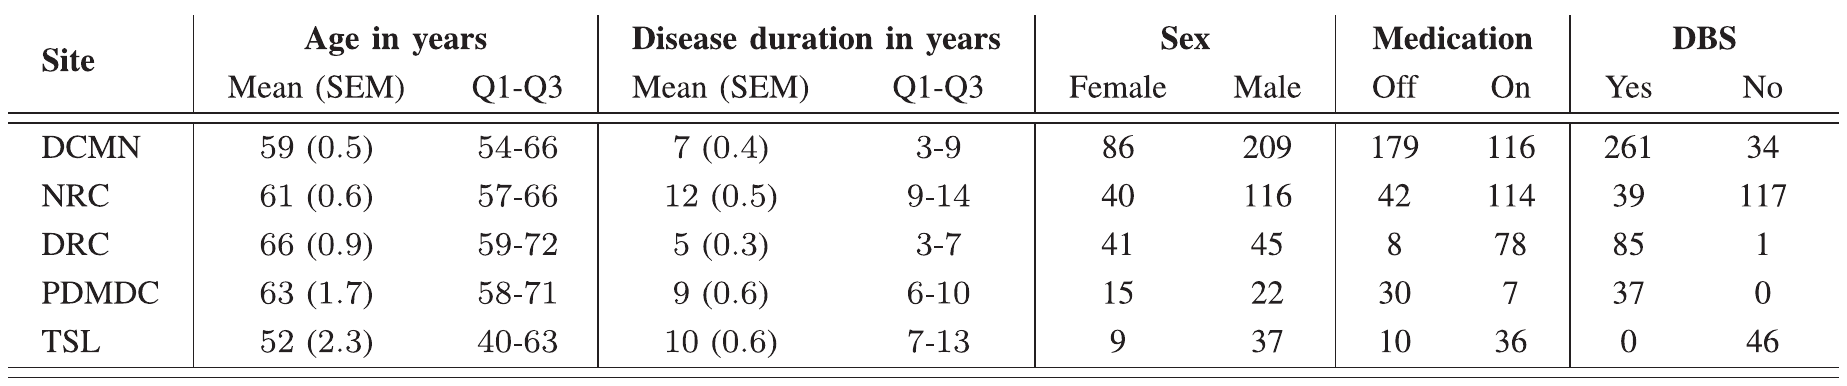
Table III. Patient Characteristics. Additional subject information has been available for 620 out of 1170 assessments. We present summary statistics (mean, SEM, lower- and upper-quantiles) of patients’ age and disease duration broken down by assessment site, and show the split by sex, medication state and presence of a deep brain stimulation device.↑
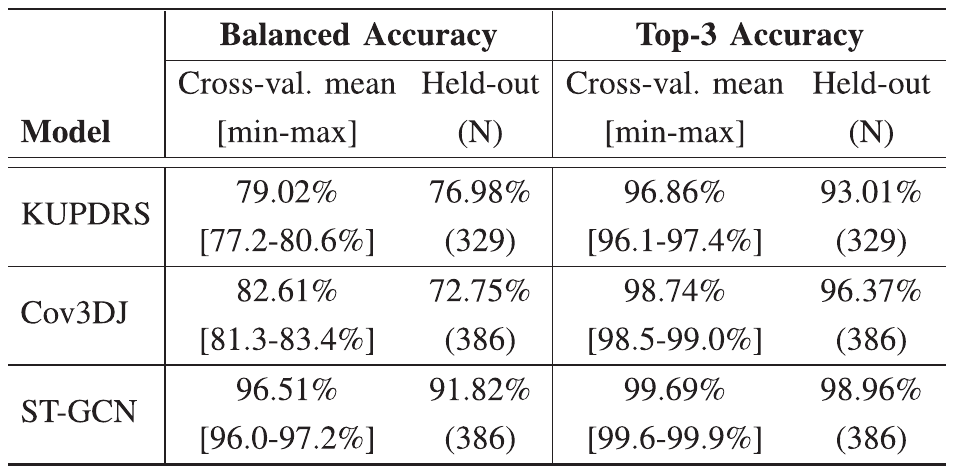
Table IV. Video-Level Activity Recognition. Comparison of video-level activity classification performance between ST-GCN and two traditional machine learning models. The 5-fold cross-validation average test performance is shown alongside the held-out site score. The ST-GCN significantly outperforms both ”shallow” models across all presented metrics.↑
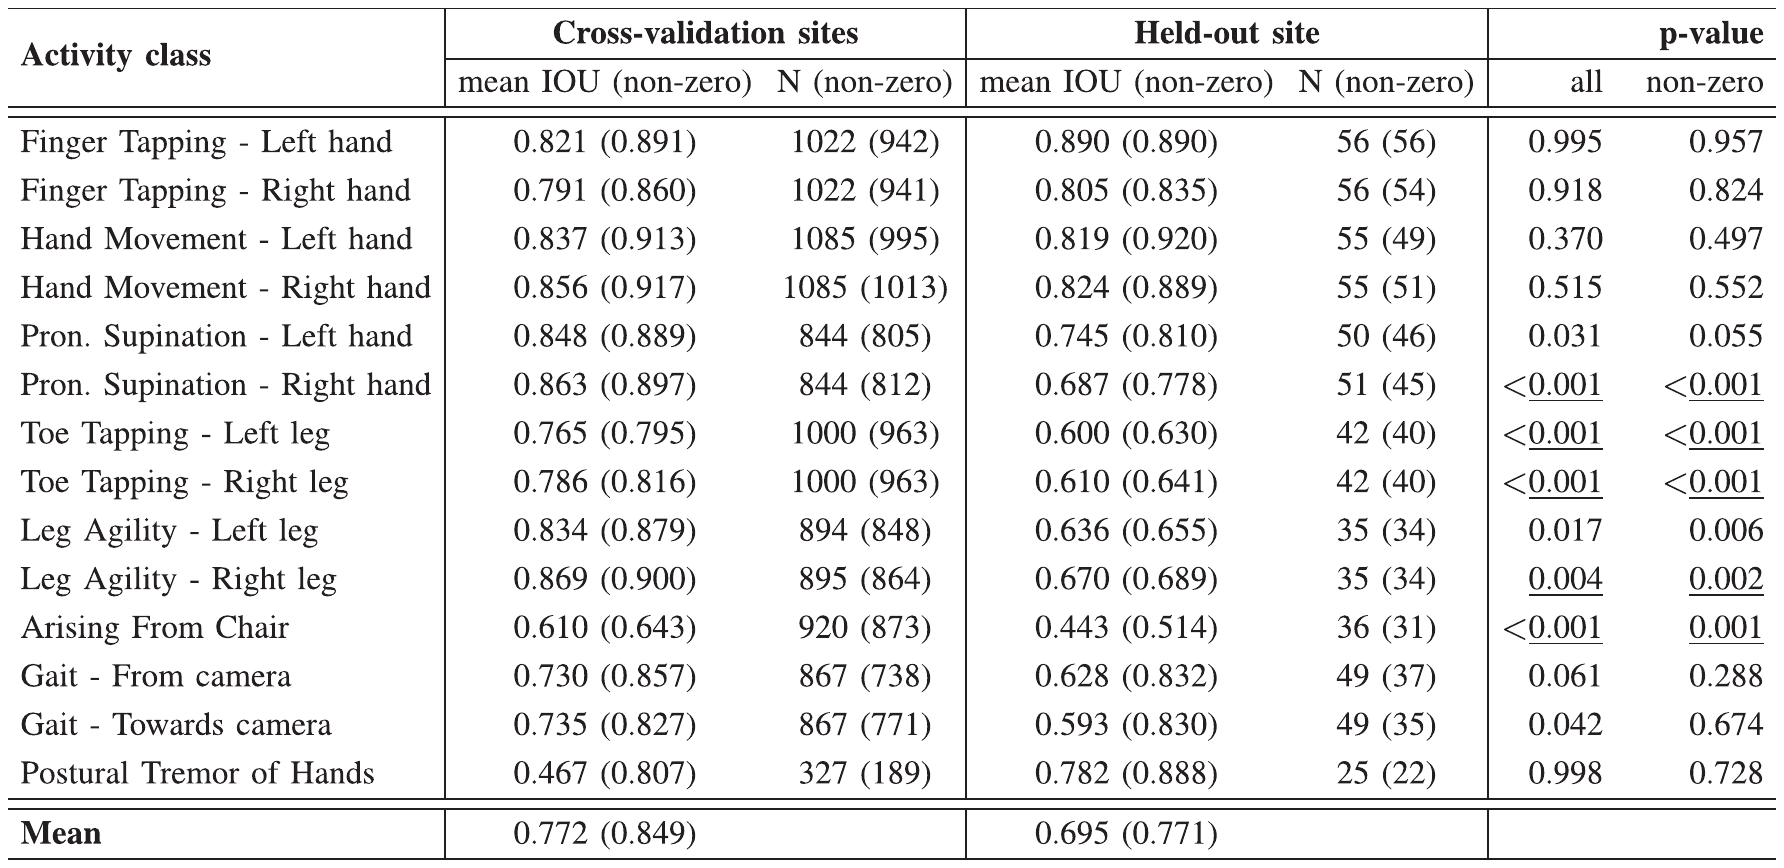
Table V. Region of Interest Prediction. ROI prediction performance measured by the IOU score for cross-validation and held-out datasets. Zero values of the metric can occur when an incorrect activity class has been matched to the human-labelled region of activity or a correct, but unlabelled, region has been chosen by the model. Metric values for samples where the model has correctly localised the target activity region have been reported in brackets. The difference between cross-validation and held-out site results has been tested using the (one-sided) Mann Whitney U-test [33]. Corresponding p-values have been reported and significance at 5% marked with the Bonferroni correction applied.↑
Acknowledgment
Data were collected at: Department of Clinical and Movement Neurosciences, Institute of Neurology, University College London; Neuroscience Research Centre, Molecular and Clinical Sciences Research Institute, St. George’s, University of London; Dementia Research Center, Institute of Neurology, University College London; Parkinson’s Disease and Movement Disorders Center, Baylor College of Medicine; The Starr Lab, University of California San Francisco. We thank all the staff involved in the data collection.
We thank the employees at Machine Medicine Technologies for labelling the regions of interest in all videos.
Competing interests
Machine Medicine Technologies have funded this work and are the owner of the developed technology. The authors declare no other Competing Financial or Non-Financial Interests.
References
- Kim, E., Helal, S. & Cook, D. Human activity recognition and pattern discovery. IEEE Pervasive Computing 9, 48–53 (2010).↑
- Popa, M., Koc, A. K., Rothkrantz, L. J. M., Shan, C. & Wiggers, P. Kinect sensing of shopping related actions. In International Joint Conference on Ambient Intelligence, 91–100 (2012).↑
- Nar, R., Singal, A. & Kumar, P. Abnormal activity detection for bank ATM surveillance. In IEEE International Conference on Advances in Computing, Communication and Informatics, 2042–2046 (2016).↑
- Almeida, A. & Alves, A. Activity recognition for movement-based interaction in mobile games. In 19th International Conference on Human-Computer Interaction with Mobile Devices and Services, Art. 55 (2017).↑
- Zin, T. T. et al. Real-time action recognition system for elderly people using stereo depth camera. Sensors 21, 5895 (2021).↑
- Lau, S. L., König, I., David, K., Parandian, B., Carius-Düssel, C. & Schultz, M. Supporting patient monitoring using activity recognition with a smartphone. In 7th International Symposium on Wireless Communication Systems, 810–814 (2010).↑
- Giebel, G. D. & Gissel, C. Accuracy of mHealth devices for atrial fibrillation screening: systematic review. JMIR mHealth and uHealth 7, e13641 (2019).↑
- Gajarawala, S. N. & Pelkowski, J. N. Telehealth benefits and barriers. Journal for Nurse Practitioners 17, 218–221 (2021).↑
- Romaissa, B., Nini, B., Sabokrou, M. & Hadid, A. Vision-based human activity recognition: a survey. Multimedia Tools and Applications 79, 30509–30555 (2020).↑
- Rupprechter, S. et al. A clinically interpretable computer-vision based method for quantifying gait in Parkinson's disease. Sensors 21, 5437 (2021).↑a↑b↑c
- Morinan, G. et al. Computer-vision based method for quantifying rising from chair in Parkinson's disease patients. Intelligence-Based Medicine 6, 100046 (2022).↑a↑b↑c
- Morinan, G. et al. Computer vision quantification of whole-body Parkinsonian bradykinesia using a large multi-site population. npj Parkinson's Disease 9, 10 (2023).↑a↑b↑c
- Goetz, C. G. et al. Movement Disorder Society-sponsored revision of the Unified Parkinson's Disease Rating Scale (MDS-UPDRS): scale presentation and clinimetric testing results. Movement Disorders 23, 2129–2170 (2008).↑
- Yan, S., Xiong, Y. & Lin, D. Spatial temporal graph convolutional networks for skeleton-based action recognition. In AAAI Conference on Artificial Intelligence, vol. 32 (2018).↑a↑b
- Yang, W., Zhang, J., Cai, J. & Xu, Z. Shallow graph convolutional network for skeleton-based action recognition. Sensors 21, 452 (2021).↑
- Dua, N., Singh, S. & Semwal, V. Multi-input CNN-GRU based human activity recognition using wearable sensors. Computing 103, 1–18 (2021).↑
- Ji, S., Xu, W., Yang, M. & Yu, K. 3D convolutional neural networks for human action recognition. IEEE Transactions on Pattern Analysis and Machine Intelligence 35, 221–231 (2013).↑
- Tran, D., Bourdev, L., Fergus, R., Torresani, L. & Paluri, M. Learning spatiotemporal features with 3D convolutional networks. In IEEE International Conference on Computer Vision, 4489–4497 (2015).↑
- Chen, L. Curse of Dimensionality (Springer, Berlin, 2009).↑
- Noori, F. M., Wallace, B., Uddin, M. Z. & Torresen, J. A robust human activity recognition approach using OpenPose, motion features, and deep recurrent neural network. In Image Analysis: 21st Scandinavian Conference, 299–310 (2019).↑
- Shi, L., Zhang, Y., Cheng, J. & Lu, H. Two-stream adaptive graph convolutional networks for skeleton-based action recognition. In IEEE/CVF Conference on Computer Vision and Pattern Recognition, 12026–12035 (2019).↑
- Kazemimoghadam, M. & Fey, N. P. An activity recognition framework for continuous monitoring of non-steady-state locomotion of individuals with Parkinson's disease. Applied Sciences 12, 4682 (2022).↑
- Rezaei, B. et al. Target-specific action classification for automated assessment of human motor behavior from video. Sensors 19, 4266 (2019).↑
- Chen, D. et al. Deep learning and alternative learning strategies for retrospective real-world clinical data. npj Digital Medicine 2, 43 (2019).↑
- Cao, Z., Hidalgo, G., Simon, T., Wei, S. & Sheikh, Y. OpenPose: realtime multi-person 2D pose estimation using part affinity fields. IEEE Transactions on Pattern Analysis and Machine Intelligence (2019).↑a↑b
- Machine Medicine Technologies Limited. Kelvin software webpage. https://machinemedicine.com/getting-started/ (2021).↑
- Machine Medicine Technologies Limited. The company's website. https://machinemedicine.com/ (2021).↑
- Morinan, G., Hauser, R. A., Schrag, A., Tang, J., O'Keeffe, J. & the M.-N. S. D. S. Group. Abbreviated MDS-UPDRS for remote monitoring in PD identified using exhaustive computational search. Parkinson's Disease 2022, 2920255 (2022).↑
- Szegedy, C., Vanhoucke, V., Ioffe, S., Shlens, J. & Wojna, Z. Rethinking the inception architecture for computer vision. In IEEE Conference on Computer Vision and Pattern Recognition, 2818–2826 (2016).↑
- Kingma, D. P. & Ba, J. Adam: a method for stochastic optimization. In International Conference on Learning Representations (2014).↑
- Hussein, M. E., Torki, M., Gowayyed, M. A. & El-Saban, M. Human action recognition using a temporal hierarchy of covariance descriptors on 3D joint locations. In 23rd International Joint Conference on Artificial Intelligence, 2466–2472 (2013).↑
- Chen, Y., Ma, H., Wang, J., Wu, J., Wu, X. & Xie, X. PD-Net: quantitative motor function evaluation for Parkinson's disease via automated hand gesture analysis. In 27th ACM SIGKDD Conference on Knowledge Discovery & Data Mining, 2683–2691 (2021).↑
- Mann, H. B. & Whitney, D. R. On a test of whether one of two random variables is stochastically larger than the other. Annals of Mathematical Statistics 18, 50–60 (1947).