Back to Research

Poster · 2020

Bayesian Estimation of Gait Cadence from Monocular Video

Peng Y, Morinan G, O’Keeffe J

Objective

Walking (gait) is a crucial motor function, and is frequently assessed as a component of clinical examination and subsequent patient management. However, the assessment of gait is often conducted in confined conditions, such as within a corridor or on a ward, and furthermore judgements are typically highly subjective in character, making them variable and unreliable.

Background

Today’s widespread availability of tablets and smartphones allows high quality video to be acquired easily and quickly in clinics. We show that such video, of patients walking up and down a corridor during clinical assessment of the UPDRS (Unified Parkinson’s Disease Rating Scale), can be used to reliably extract step frequency, which correlates inversely with disease severity.

Methods

The computer vision technique of pose estimation1 was used to track body parts throughout a video, and from this multiple periodic time series related to gait were extracted.2 Identification of steps was done using peak detection, optimised for this application. The final estimate of gait step frequency is arrived at by Bayesian estimation using a conjugate prior for normal likelihood with unknown mean and unknown variance.

Results

This work utilised a dataset of videos recorded during motor examinations conducted by trained assessors using the MDS-UPDRS rating scale. For a subset of these videos the step frequency was manually labelled; these labels were used as ground truth to calibrate both the peak detection algorithm and the prior. The method was then applied to the entire dataset of videos, allowing us to correlate step frequencies to the MDS-UPDRS severity ratings assigned by assessors at gait examinations.

Conclusions

Automated analysis of a single monocular video provides good estimation of a key parameter of motor dysfunction. Unlike previous works based on multiple views, or expensive bespoke equipment, our method dovetails with current assessment methods, so is easily integrated into clinical workflows.

Figures
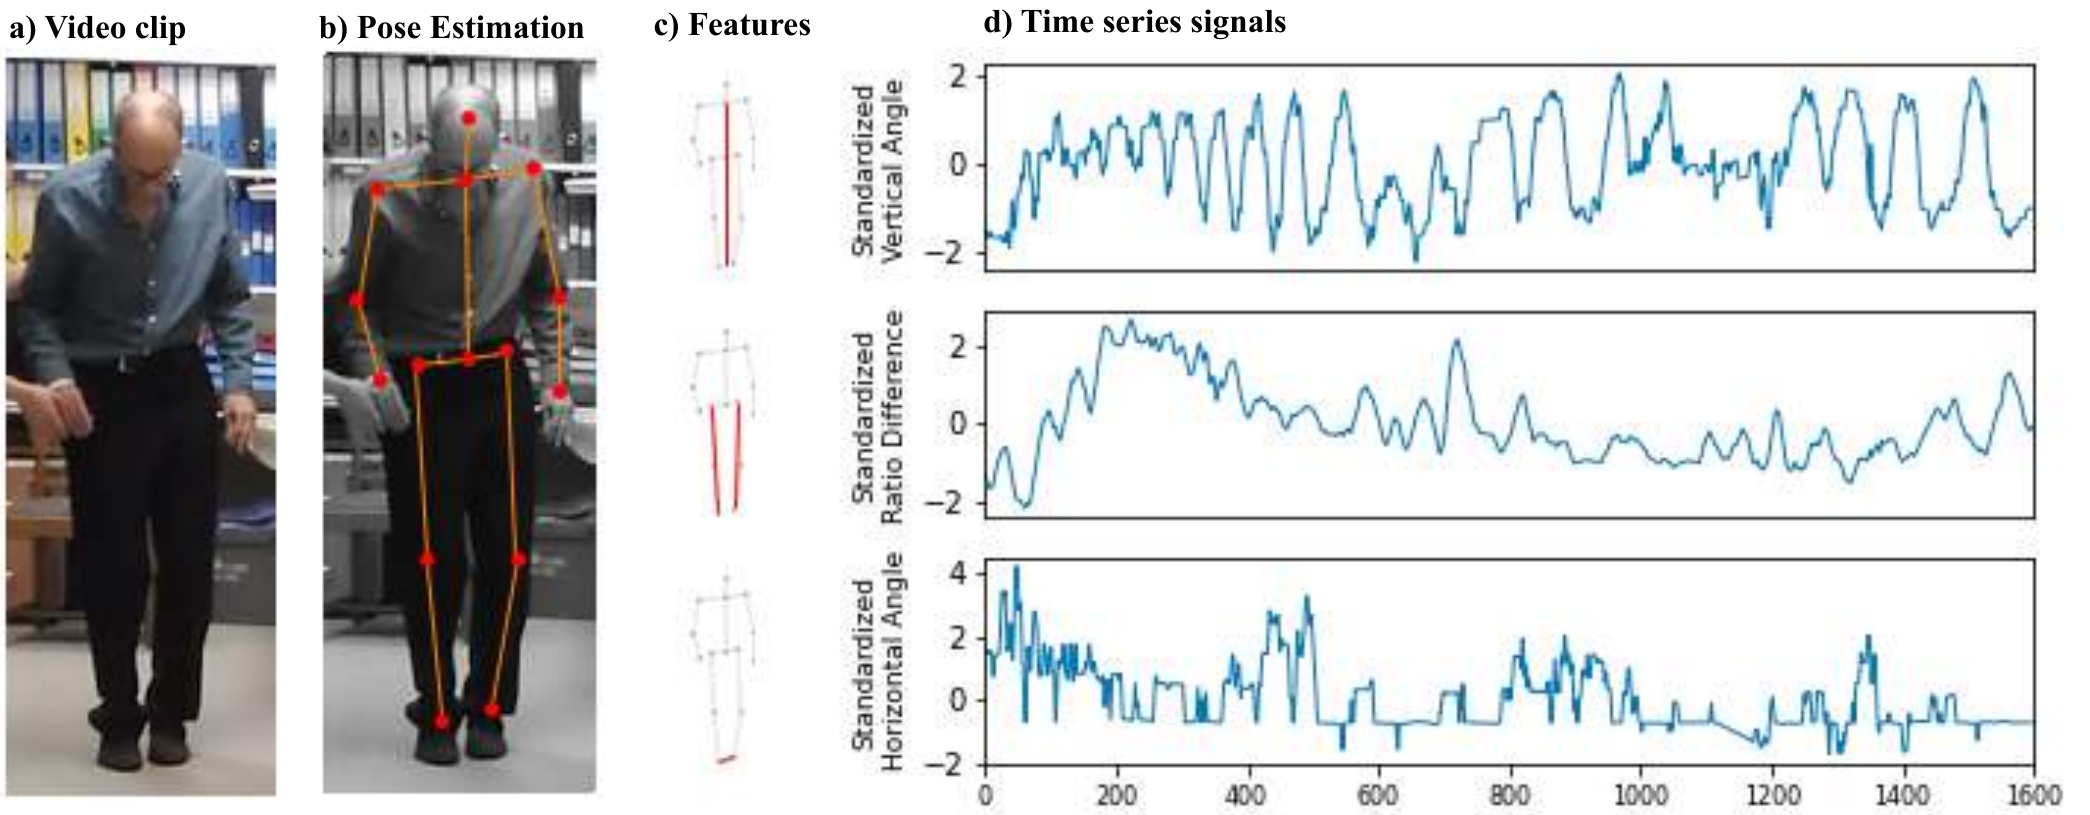
Figure 1: the signal extraction process, from a video clip of a Parkinson's disease patient walking towards the camera, to the body keypoints identified by pose estimation, to three highlighted feature skeletons, to three standardised time-series signals over 1,600 frames: vertical angle of the body, left-right leg ratio difference and the horizontal angle between the ankles.
Figure 1. Signal extraction process example. (a) Video clip of a Parkinson’s disease patient walking towards the camera. (b) Body keypoints are identified using the pose estimation system OpenPose.1 (c) From these keypoints three features are extracted; the vertical angle of the body (top row), the ratio of left:right leg minus the ratio of right:left leg2 (middle row), and the horizontal angle of the line between ankles (bottom row). (d) The sequential frames of the video clip are used to construct three periodic signals; these signals are independently standardised (mean = 0, standard deviation = 1).
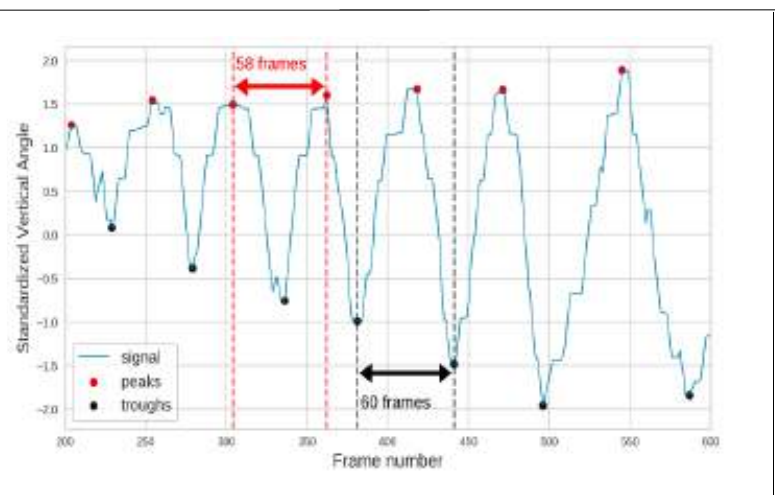
Figure 2: a segment of the standardised vertical angle signal with detected peaks marked in red and troughs in black, and two annotated intervals of 58 and 60 frames between successive peaks.
Figure 2. Step detection on a vertical angle of the body signal (standardised) from a video clip recorded at 30 frames per second. Peaks and troughs correspond to the frame when a foot is at rest on the ground.
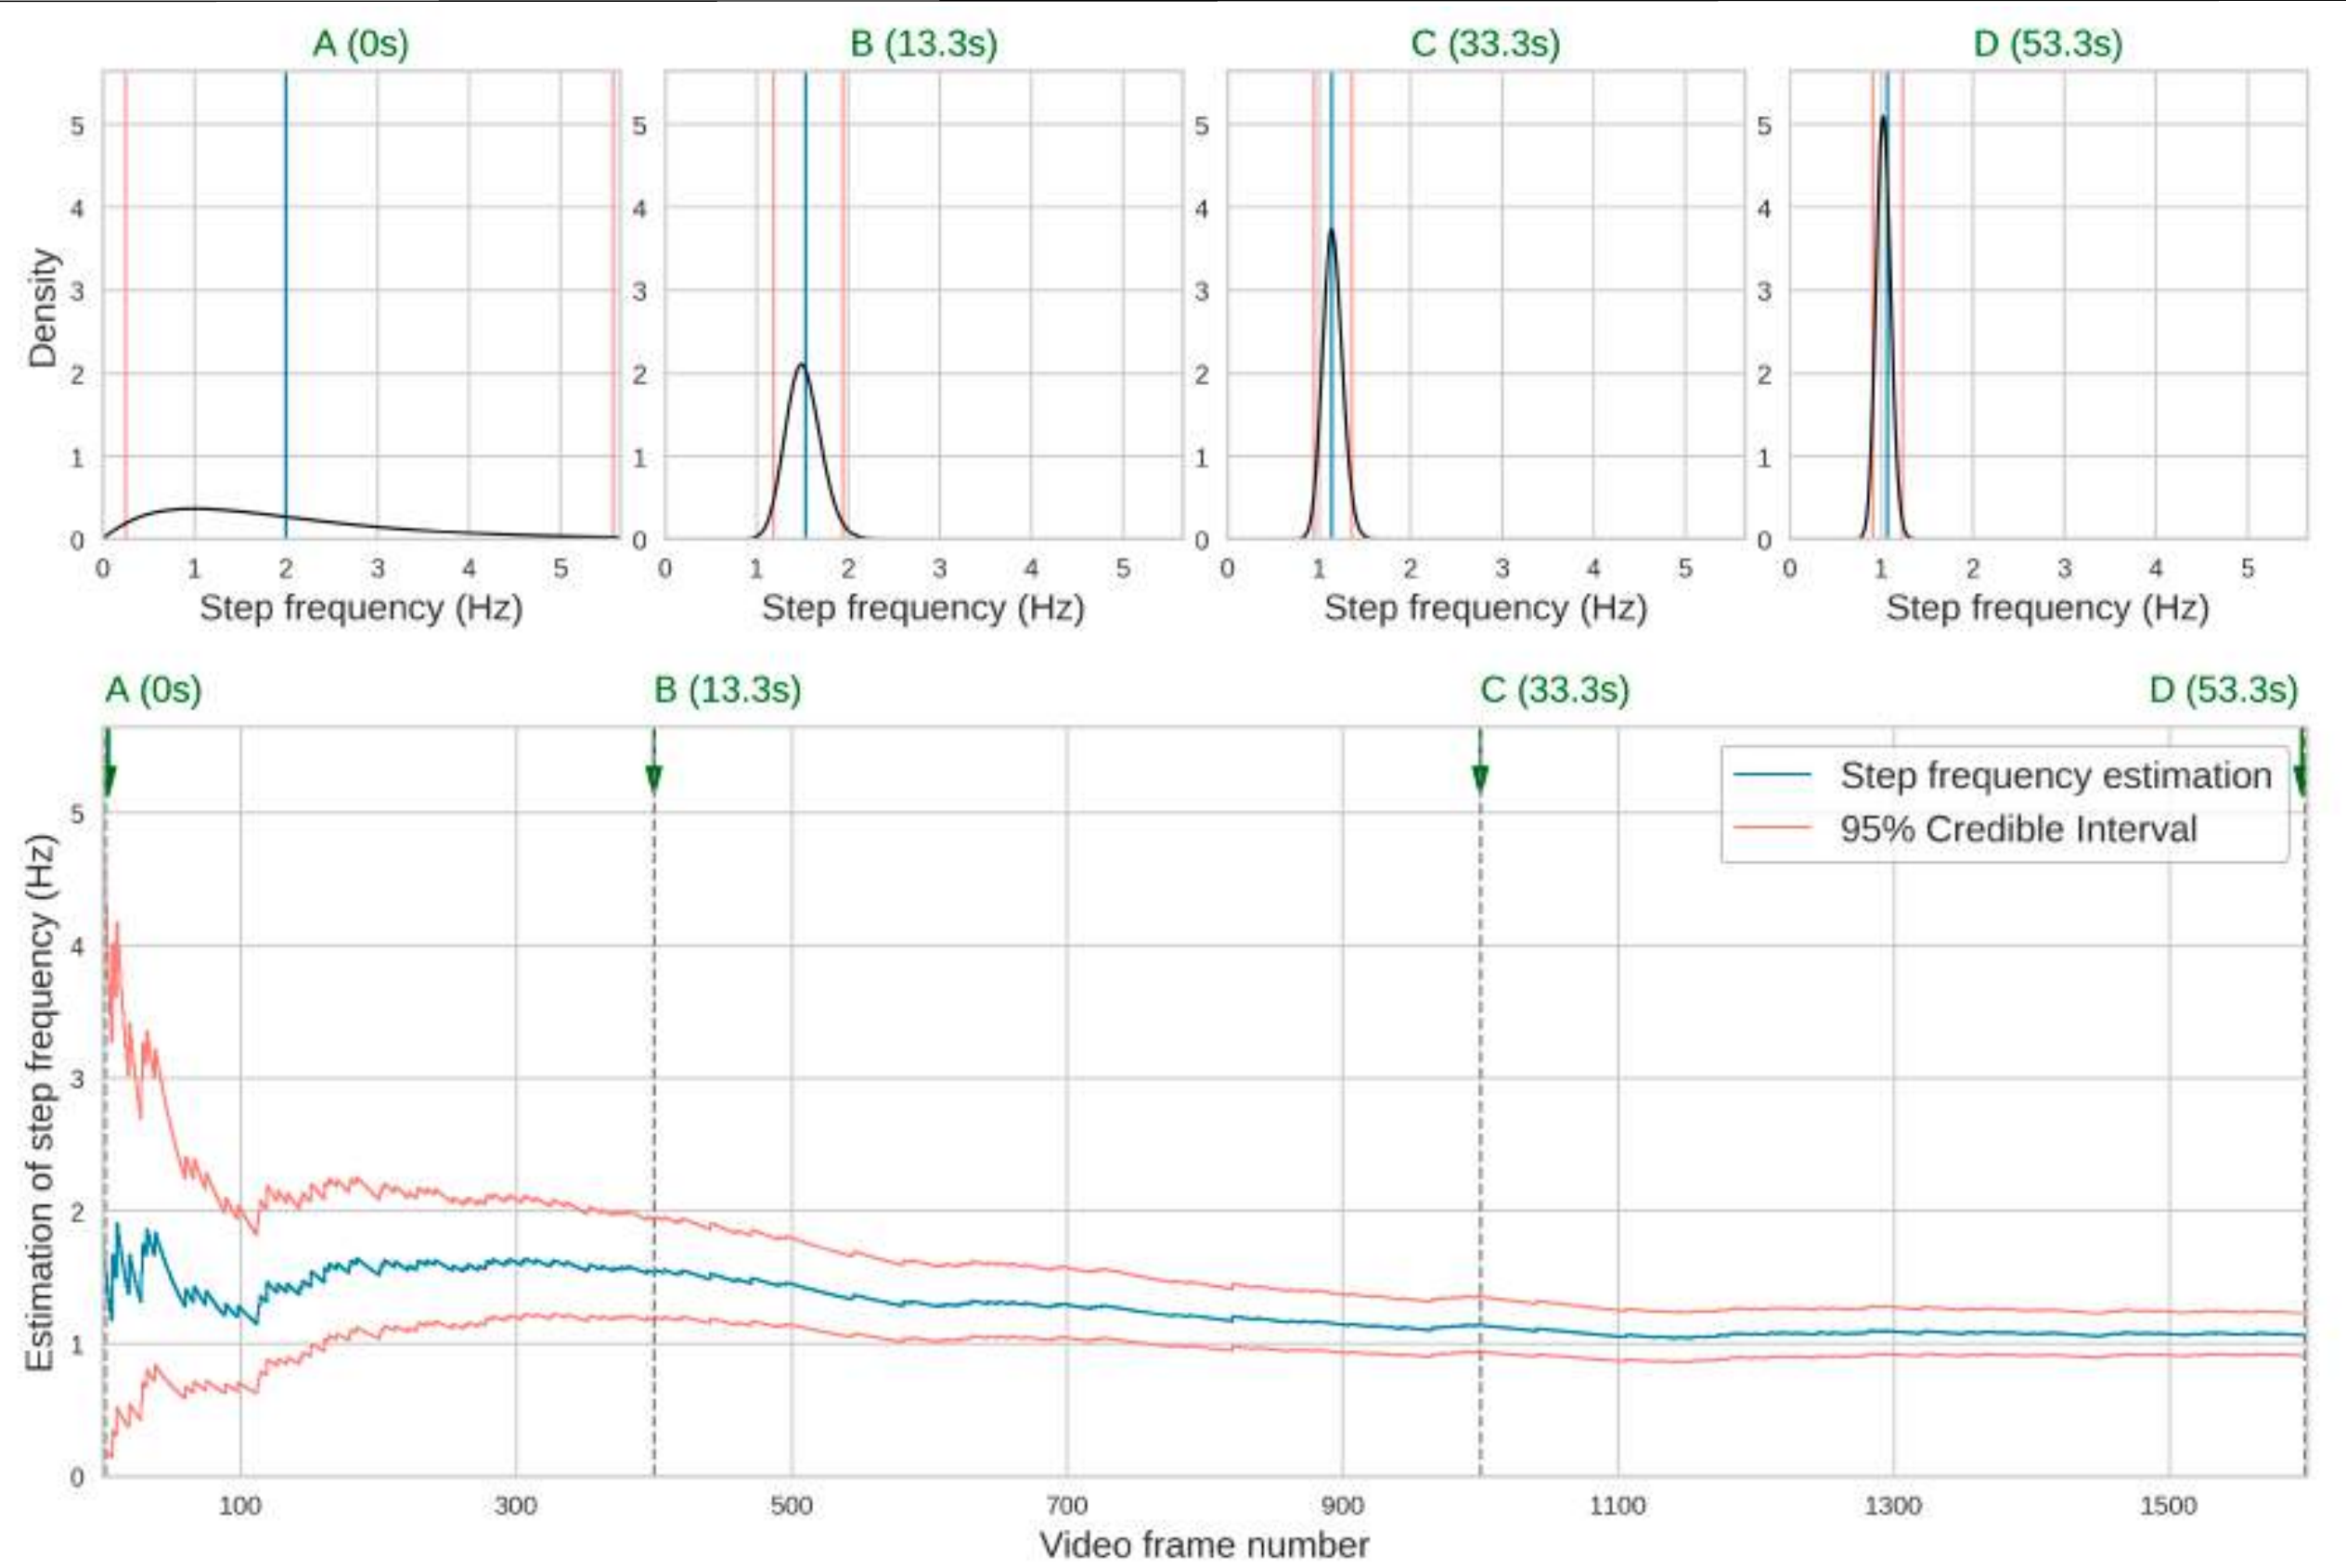
Figure 3: the posterior distribution over step frequency at four times — 0, 13.3, 33.3 and 53.3 seconds — narrowing from a broad prior centred near 2 Hz to a sharp peak just above 1 Hz, with the lower panel showing the running estimate and its 95% credible interval converging over roughly 1,600 video frames.
Figure 3. Process of Bayesian updating, with Poisson likelihood and conjugate prior gamma model, of the rate of step occurrence for a video recorded at 30 frames per second. The prior gamma distribution has parameters α = 2, β = 1, giving a step frequency of 2 Hz, with a credible interval covering a range of plausible human step frequency, 0.24–5.57 Hz (A). By the end of the video (53.3 seconds) the posterior gamma distribution parameters are α = 117, β = 161, giving a step frequency of 1.06 Hz, and the credible interval has narrowed to 0.91–1.23 Hz (D).
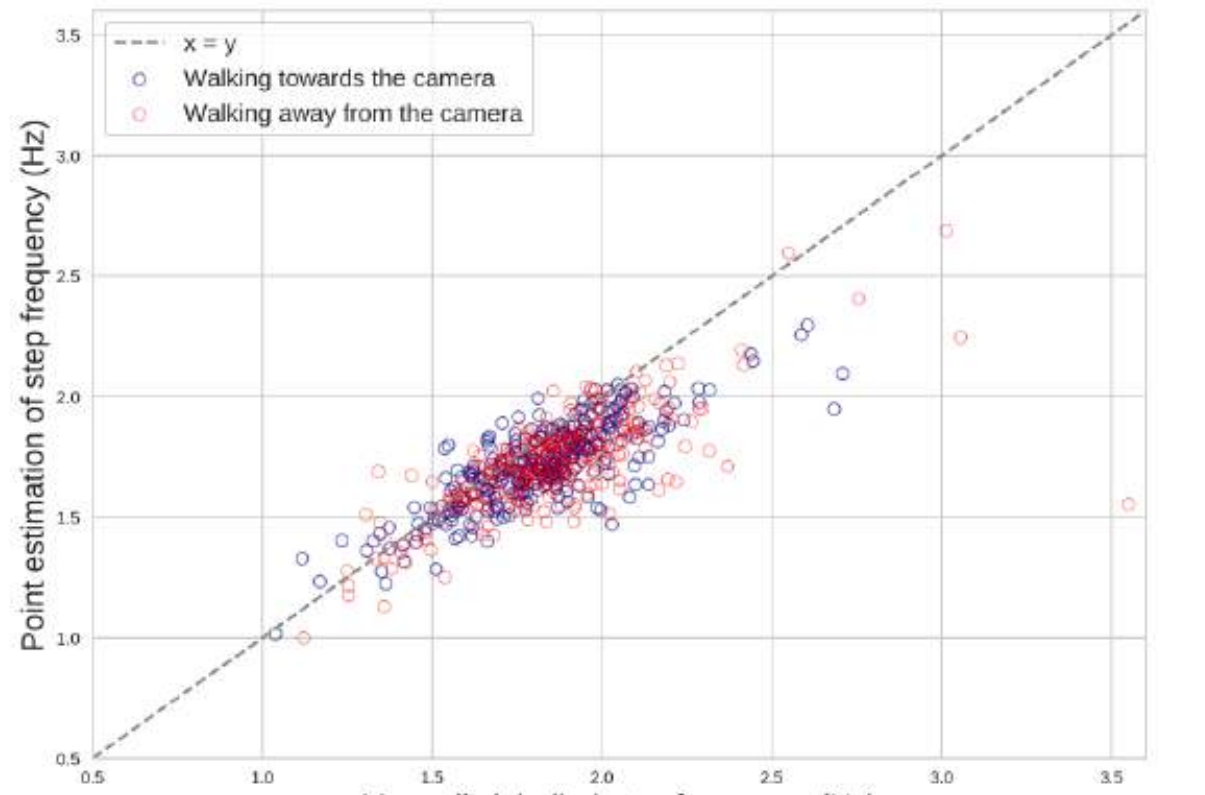
Figure 4: a scatter plot of the point estimate of step frequency against the manually labelled step frequency for 593 clips, clustered along the x equals y line mostly between 1.5 and 2 Hz, with clips walking towards and away from the camera overlapping.
Figure 4. Relationship between the manually labelled and point estimation of step frequency from 593 video clips from the test dataset. The Pearson correlation coefficient is 0.758, which was significant (p-value < 0.001).
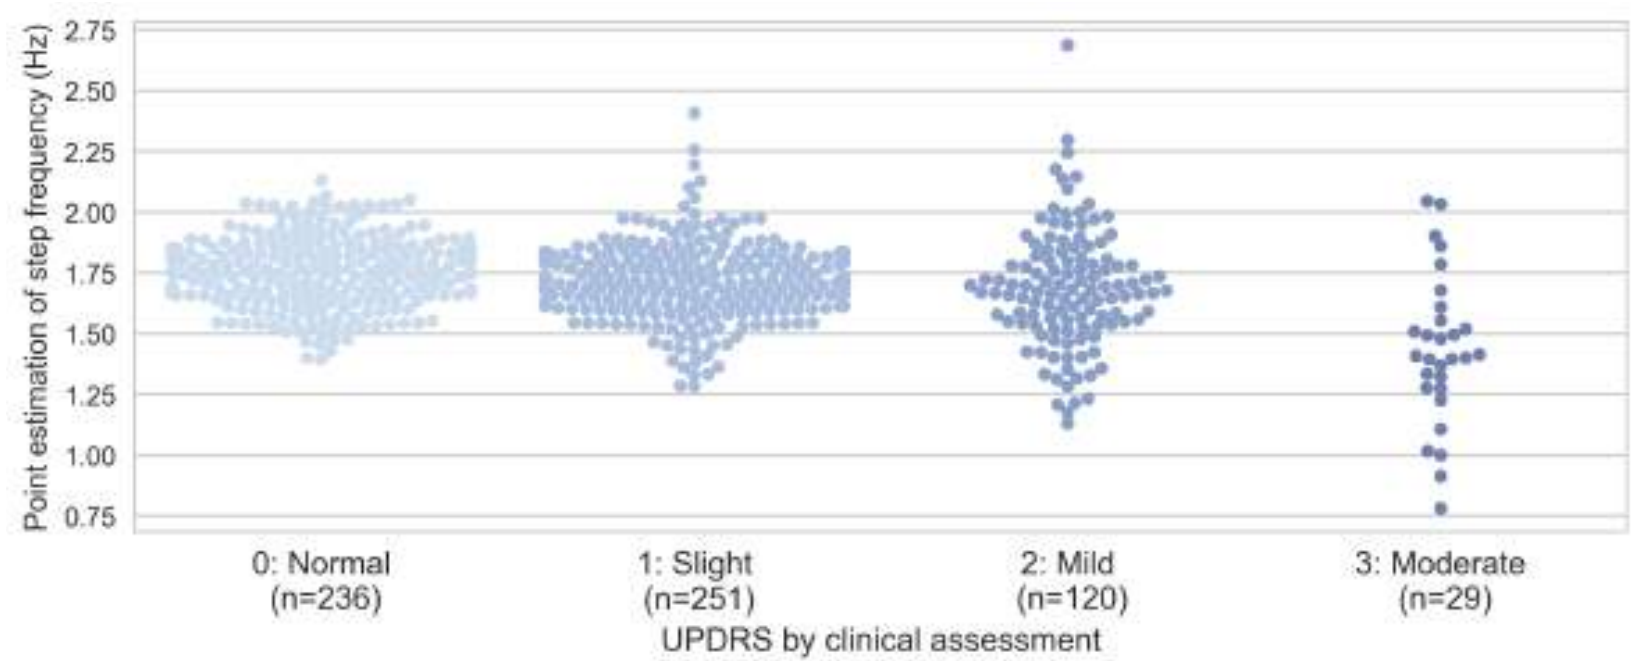
Figure 5: swarm plots of estimated step frequency by clinical gait rating. Normal (n = 236) and slight (n = 251) cluster around 1.75 Hz, mild (n = 120) is slightly lower and more spread, and moderate (n = 29) is lower again with a wide spread down to about 0.75 Hz.
Figure 5. Point estimation of step frequency against MDS-UPDRS ratings for the 636 video clips in the dataset for which such ratings were available. The Pearson correlation coefficient was −0.280 and significant (p-value < 0.001).

Conclusion

We demonstrate that gait cadence can be measured robustly with short monocular video clips recorded within a standard clinical setting, using a calculation method that is transparent and interpretable.

References

  1. Cao, Z., Hidalgo Martinez, G., Simon, T., Wei, S. & Sheikh, Y. A. OpenPose: realtime multi-person 2D pose estimation using Part Affinity Fields. IEEE Transactions on Pattern Analysis and Machine Intelligence (2019).↑a↑b
  2. Sato, K., Nagashima, Y., Mano, T., Iwata, A. & Toda, T. Quantifying normal and Parkinsonian gait features from home movies: practical application of a deep learning based 2D pose estimator. PLoS ONE 14(11), e0223549 (2019).↑a↑b

About this poster

This research was originally presented as a poster by Machine Medicine Technologies. This HTML version has been reformatted for accessibility and web presentation, while preserving the content of the original poster.