Back to Research

Poster · 2021

A Computer-Vision Based Method for Quantifying Parkinsonian Gait

S. Rupprechter, G. Morinan, Y. Peng and J. O’Keeffe

Objective

We proposed and evaluated a novel approach for estimating severity of gait impairment in Parkinson’s disease using a computer vision-based methodology.

Background

Gait is a core motor function and is impaired in numerous neurological diseases, including Parkinson’s disease. In the clinic, gait impairment is commonly rated as part of the Movement Disorder Society Unified PD Rating Scale (MDS-UPDRS1) assessment (item 3.10). The system we developed can be used to obtain an objective (second) opinion for a rating to catch potential errors, or to gain an initial rating in the absence of a trained clinician; for example during remote home assessments.

Methods

Videos (n = 766) were collected as part of routine MDS-UPDRS gait assessments of Parkinson’s patients, and the deep learning library OpenPose2 was used to extract body key-point coordinates for each frame. Data were recorded at five clinical sites using commercially available mobile phones or tablets, and had an associated severity rating from a trained clinician (0, 1, 2 or 3; the data did not include severity 4 which would mean the patient is unable to walk). Six features were calculated from time-series signals of the extracted key-points. These features characterised key aspects of the movement including step frequency (estimated using a novel Gamma-Poisson Bayesian model), stride width, arm swing, postural control, and roughness of movement. An ordinal random forest classification model (with one class for each of the possible ratings) was trained and evaluated using 10-fold cross validation.
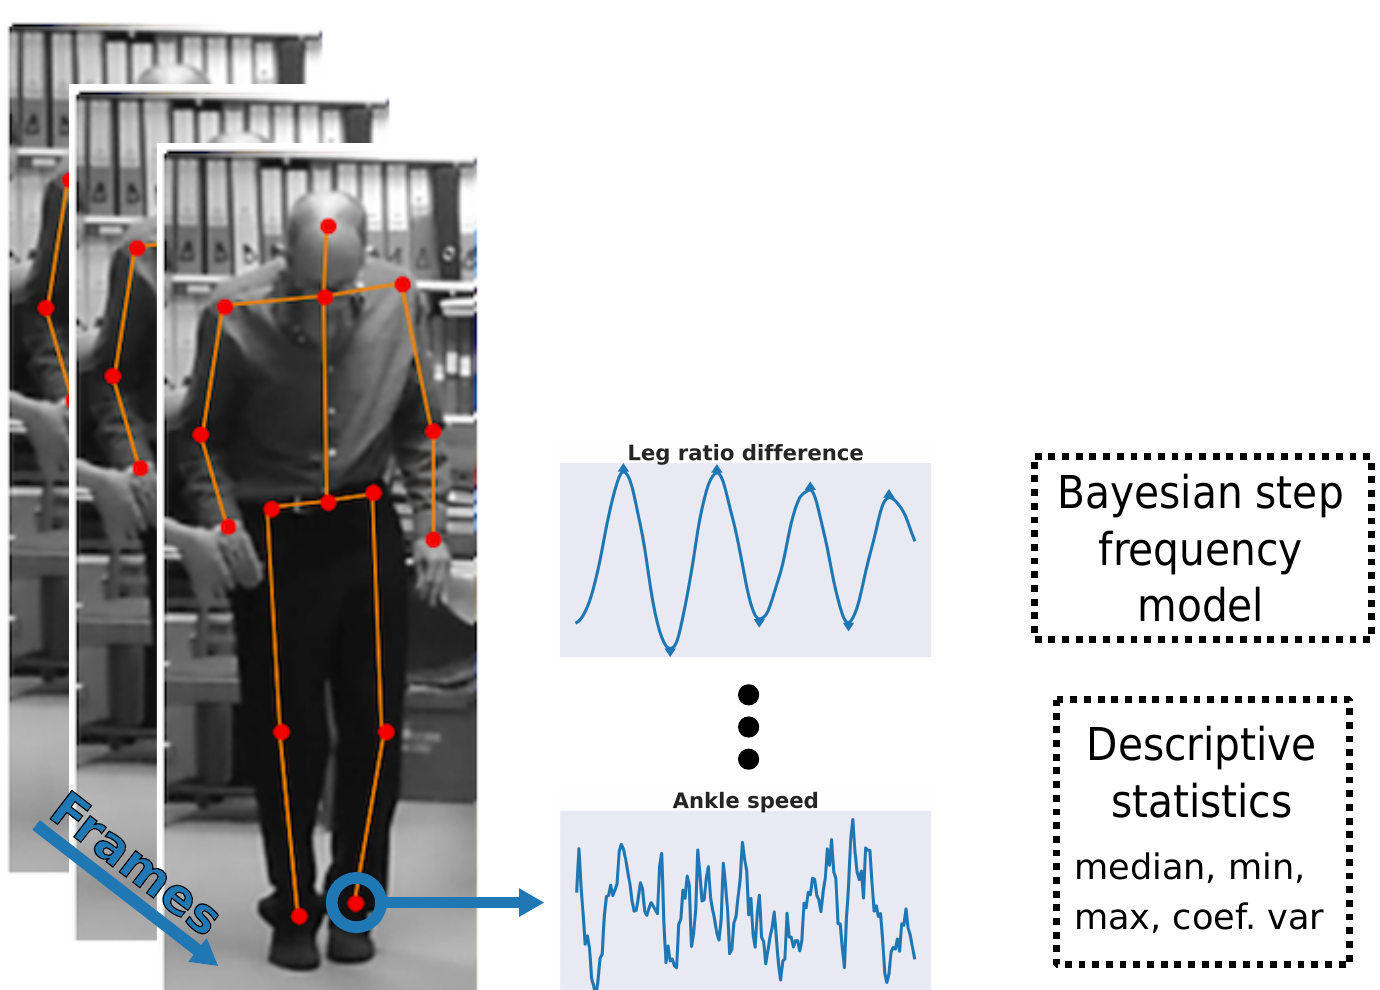
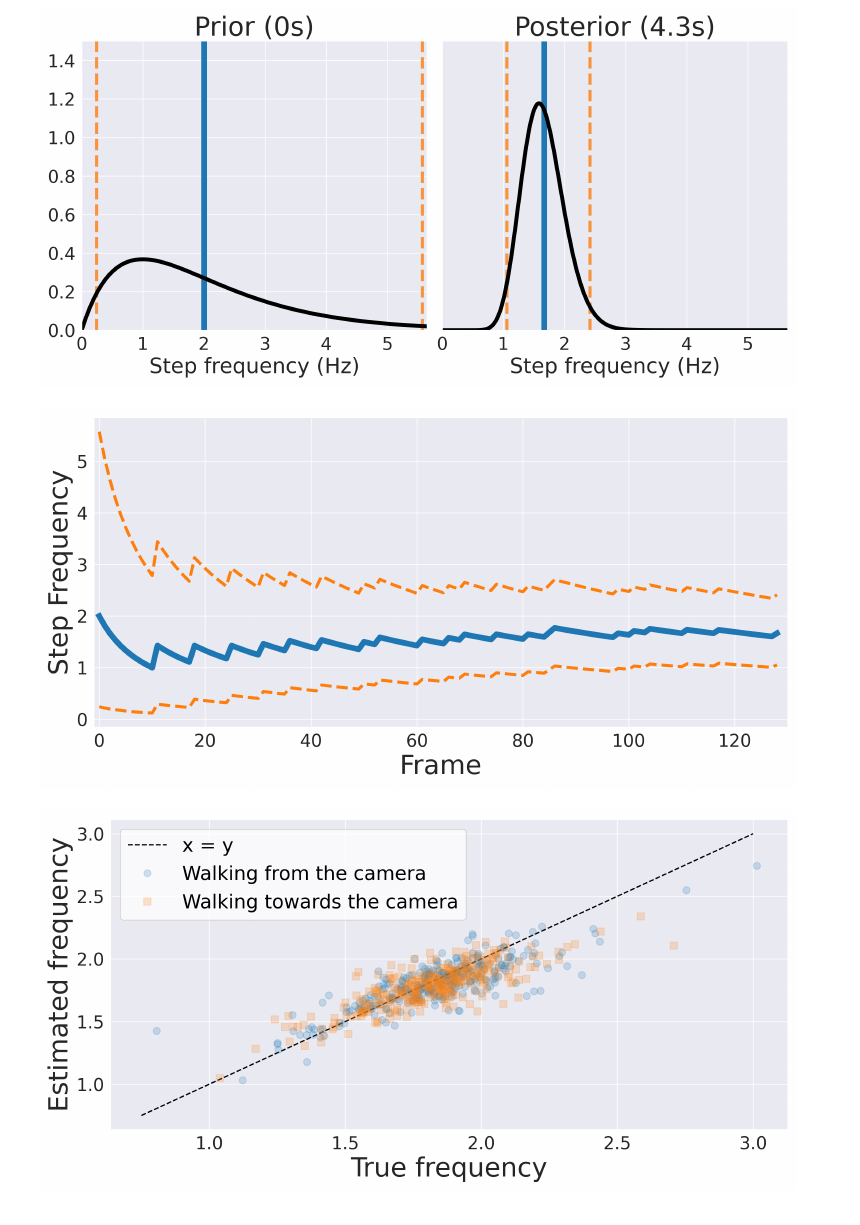
Figure 1: a stack of video frames of a patient walking, overlaid with extracted body key-points joined into a skeleton, feeding two example time-series signals — leg ratio difference, which oscillates regularly, and ankle speed, which is noisier — that are passed either to a Bayesian step frequency model or to descriptive statistics such as median, min, max and coefficient of variation.
Figure 1. Body key-points were extracted from each frame and signals were created by combining the time-series of various key-points. Features were extracted based on different methods: (a) a Bayesian step frequency model integrating information over time, and (2) summary statistics such as the median amplitude.
Figure 2: three panels of the Bayesian step frequency model. The prior at 0 seconds is a broad right-skewed distribution over step frequency with wide credible bounds; the posterior at 4.3 seconds is a narrow peak just above 1.5 Hz. The posterior mean settles from about 2 Hz to roughly 1.6 Hz over 129 frames as its 95% credible interval narrows. A scatter plot of estimated against true frequency clusters tightly along the x equals y line for clips walking both towards and away from the camera.
Figure 2. (Top) Examples of the prior distribution (left) and a posterior distribution after 129 frames (approximately 4.3 s). (Middle) The evolution of the posterior mean and 95% credible interval for the first 129 updates. (Bottom) Point estimates of the posterior distributions at the last frame of each video were highly correlated with the true labels (Pearson’s r = 0.82, p < 0.001).
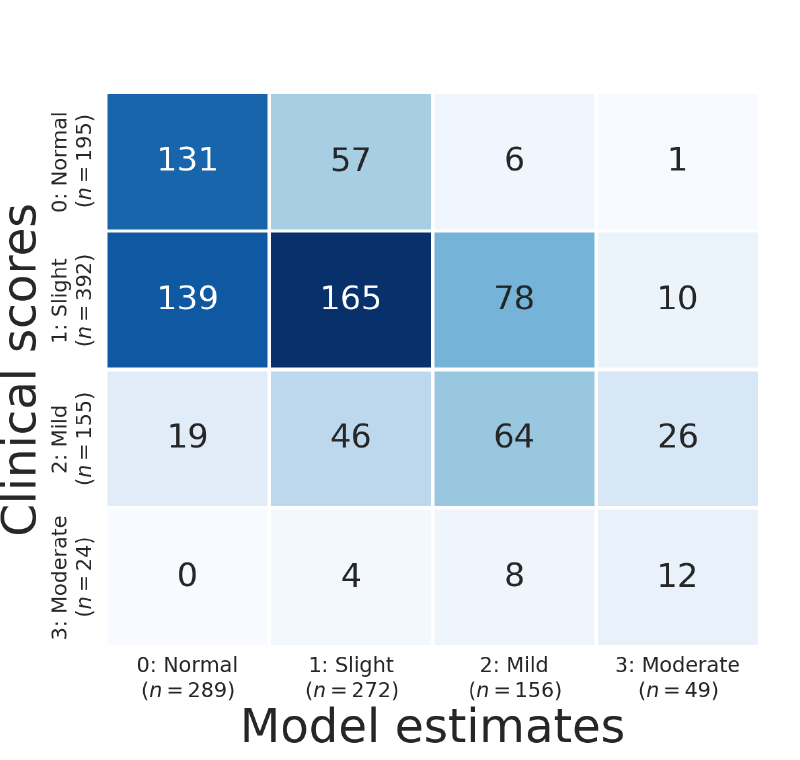
Figure 3: a four-by-four confusion matrix of clinical scores against model estimates. Of 195 normal assessments the model estimated 131 normal, 57 slight, 6 mild and 1 moderate; of 392 slight assessments it estimated 139 normal, 165 slight, 78 mild and 10 moderate; of 155 mild assessments it estimated 19 normal, 46 slight, 64 mild and 26 moderate; and of 24 moderate assessments it estimated 0 normal, 4 slight, 8 mild and 12 moderate.
Figure 3. Confusion matrix showing the results from the 10-fold cross-validation. The balanced accuracy was 50% (chance = 25%).

Results

Step frequency point estimates from the Bayesian model were highly correlated with manually labelled step frequencies of 600 video clips showing patients walking towards or away from the camera (Pearson’s r = 0.82, p < 0.001). Our classifier achieved a balanced accuracy of 50% (chance = 25%). Estimated UPDRS ratings were within one of the clinicians’ ratings in 95% of cases.
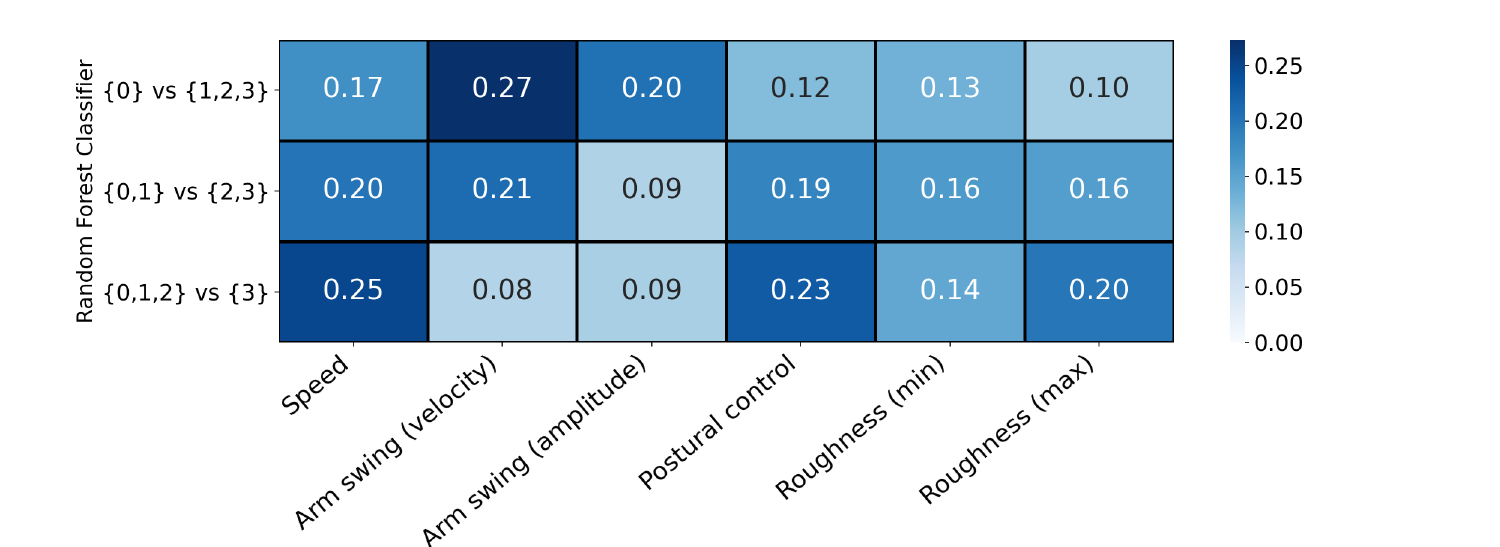

Figure 4: a heatmap of feature importance for the three random forest classifiers. For normal versus impaired, arm swing velocity is highest at 0.27 followed by arm swing amplitude at 0.20 and speed at 0.17. For the middle split, speed and arm swing velocity lead at 0.20 and 0.21. For the most severe split, speed is highest at 0.25 followed by postural control at 0.23 and maximum roughness at 0.20.
Figure 4. Feature importance of the three random forest classifiers contained within the ordinal classifier. The impurity-based (Gini) importance was calculated as the normalised total reduction of the Gini coefficient by the feature. Arm swing features were important to distinguish normal gait from Parkinsonian gait. Smoothness features were important to distinguish between different levels of Parkinsonian impairment.
Figure 5: three groups of five videos, grouped by whether the model's residual against the original rating was 2, 1 or 0, each showing the original examiner's rating, the re-rating by a senior neurologist and the model's rating, shaded red, yellow and green by absolute residual. In four of the five videos where the residual was 2, the expert's re-rating differs from the original rating.
Figure 5. Fifteen videos were sent to a senior neurologist for re-rating: five videos for which the model estimation disagreed with the original examiner’s rating by 2, and ten videos for which the residual was 1 or 0 points. Each column shows the three different ratings (original examiner, model and expert) for a video, with colour shading indicating the level of absolute residual (red = 2, yellow = 1, green = 0). For 4 of the 5 videos with a residual of 2, the expert disagreed with the original rating.

Conclusions

The severity of gait impairment in Parkinson’s disease can be estimated using a single patient video, recorded using a consumer mobile device and within standard clinical settings; i.e. videos were recorded in various hospital hallways and offices rather than gait laboratories. This approach can support clinicians during routine assessments by providing an objective second opinion of the rating, and has the potential to be used for remote home assessments.

References

  1. Goetz, C. G. et al. Movement Disorder Society-sponsored revision of the Unified Parkinson's Disease Rating Scale (MDS-UPDRS): scale presentation and clinimetric testing results. Movement Disorders 23, 2129–2170 (2008).↑
  2. Cao, Z. et al. OpenPose: realtime multi-person 2D pose estimation using Part Affinity Fields. IEEE Transactions on Pattern Analysis and Machine Intelligence 43, 172–186 (2019).↑

Poster Video

Poster video presentation accompanying the MDS Congress 2021 poster.

About this poster

This research was originally presented as a poster by Machine Medicine Technologies. This HTML version has been reformatted for accessibility and web presentation, while preserving the content of the original poster.