Back to Research

Poster · 2019

Assessment of Parkinson’s Disease Severity using Machine Learning

Morinan, G. and O’Keeffe, J.

Introduction

Motor assessment in Parkinson’s disease (PD) currently relies on human assessors performing assessments, making it expensive and subjective. A system for the objective assessment of motor dysfunction in PD, that could be deployed at scale, would have applications in clinical trials, treatment management, and in programming Deep Brain Stimulation (DBS) devices, a major recent advance in PD therapeutics.

Machine Medicine’s KELVIN-PD platform provides objective, scalable motor assessment using video capture and machine learning techniques, with no dedicated hardware requirements. Here we present results for three tests that assess motor function in the hand and foot.

Data capture

  1. Access KELVIN-PD from any smart device via an app or the website.
  2. Open the digitised assessment form, which has embedded video capture.
  3. Record the patient performing any of the UPDRS* motor function tests.
  4. The video is analysed frame by frame so that all relevant information is extracted.
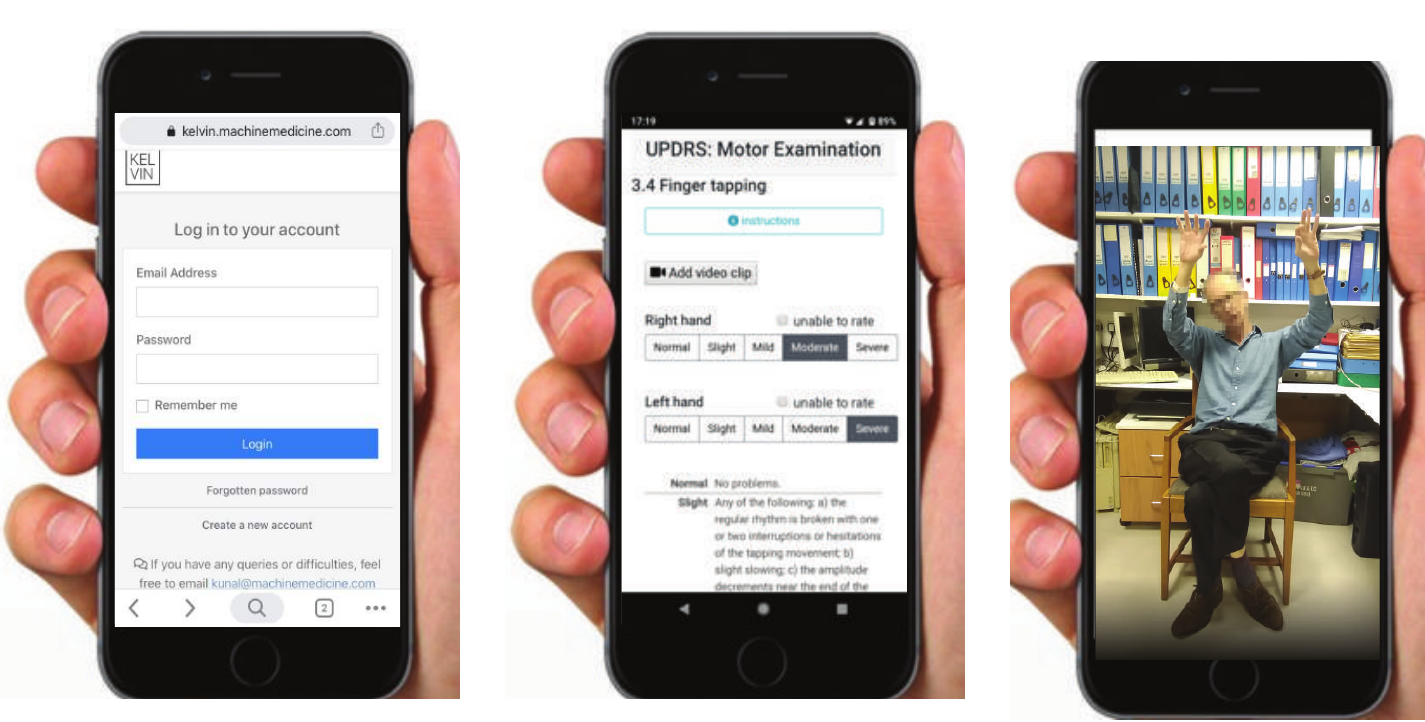
Figure 1: three photographs of a hand holding a smartphone. The first shows the KELVIN-PD login page at kelvin.machinemedicine.com, the second the digitised UPDRS motor examination form for item 3.4, finger tapping, with an Add video clip button and Normal to Severe rating buttons for each hand, and the third a recorded video of a seated patient holding both hands raised.
Figure 1. *UPDRS: Unified Parkinson’s Disease Rating Scale
Figure 2: a fanned-out stack of successive video frames from a recording of a seated patient with both arms raised, illustrating that the clip is processed one frame at a time.
Figure 2

Dataset

The predictive models are developed using videos of patients from across the severity spectrum, recorded by trained UPDRS assessors at a range of institutions.

Figure 3: three histograms of clinician-assigned severity. For all three tests the slight category is the largest, followed by normal and mild, with moderate and severe assessments comparatively rare.
Figure 3

Analysis

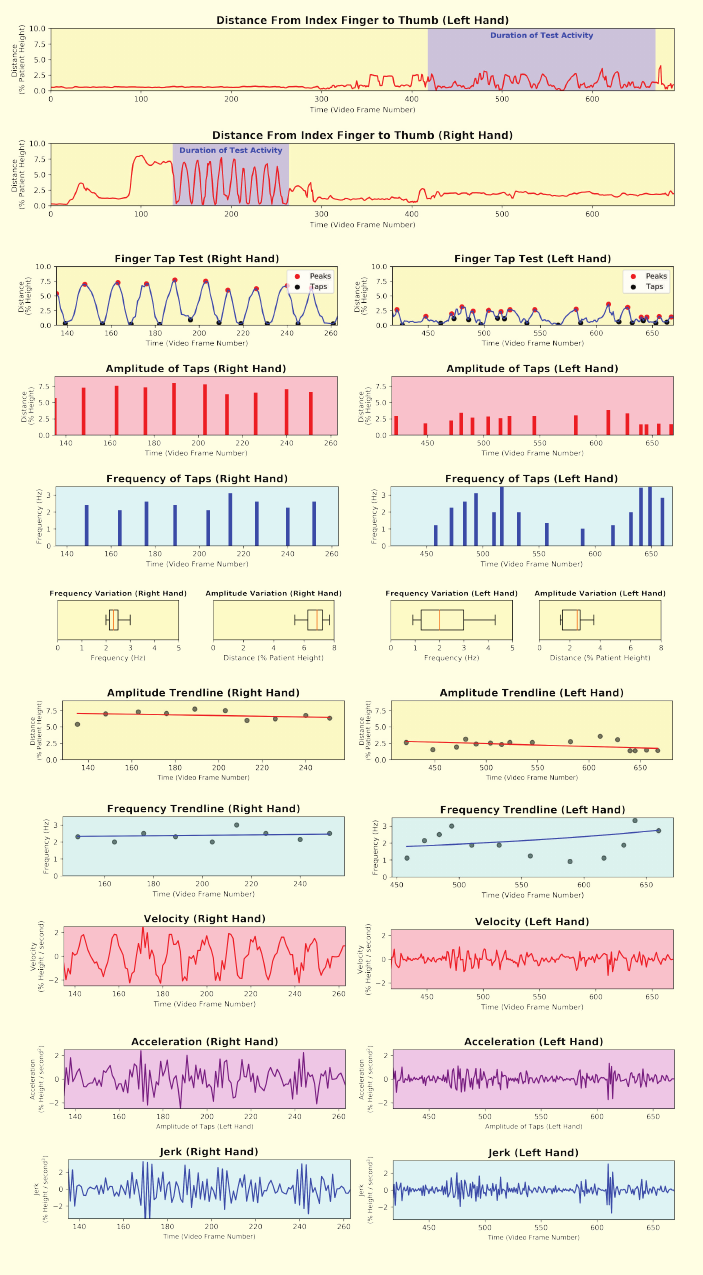
Figure 4: a column of paired plots extracted from a 23 second finger tapping video, for the right hand showing mild symptoms and the left hand showing severe symptoms. The traces cover index-finger-to-thumb distance over the whole recording with the test activity highlighted, detected taps with peaks marked, tap amplitude and frequency, amplitude and frequency variation, amplitude and frequency trendlines, and velocity, acceleration and jerk. The right hand's taps are large and regular while the left hand's are small and irregular.
Figure 4. Information extracted from a 23 second video of a patient performing the finger tapping test with both hands. Right hand: mild symptoms. Left hand: severe symptoms.

Feature selection

Many features of movement, such as amplitude and frequency of actions, correlate with disease severity.
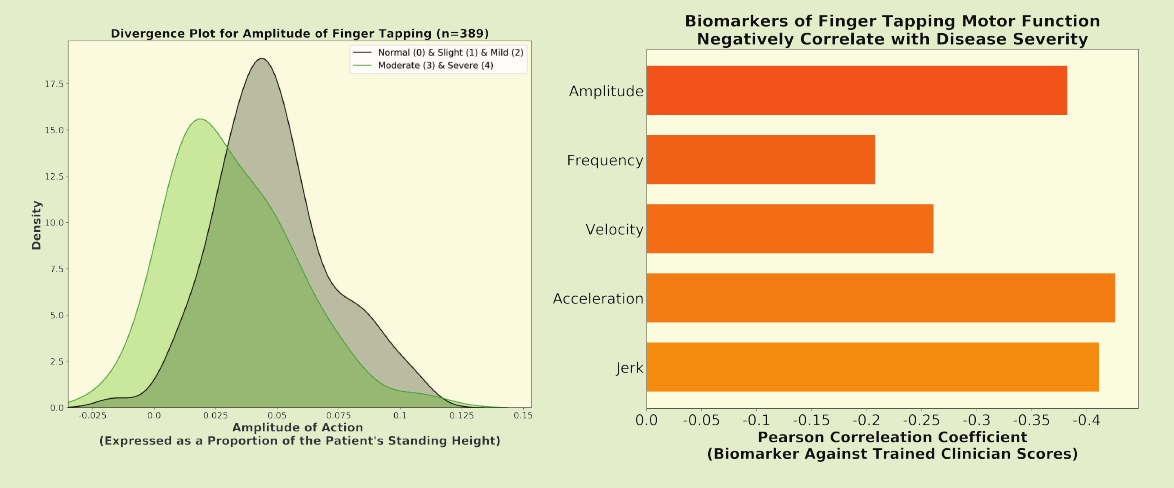
Figure 5: a divergence plot of finger tapping amplitude showing that normal, slight and mild assessments peak at a higher amplitude than moderate and severe ones, alongside a bar chart in which amplitude, acceleration and jerk correlate with clinician scores at around minus 0.4, velocity at about minus 0.24 and frequency at about minus 0.20.
Figure 5

Model selection

Linear regression models achieve worse results than the more complex random forest regression.
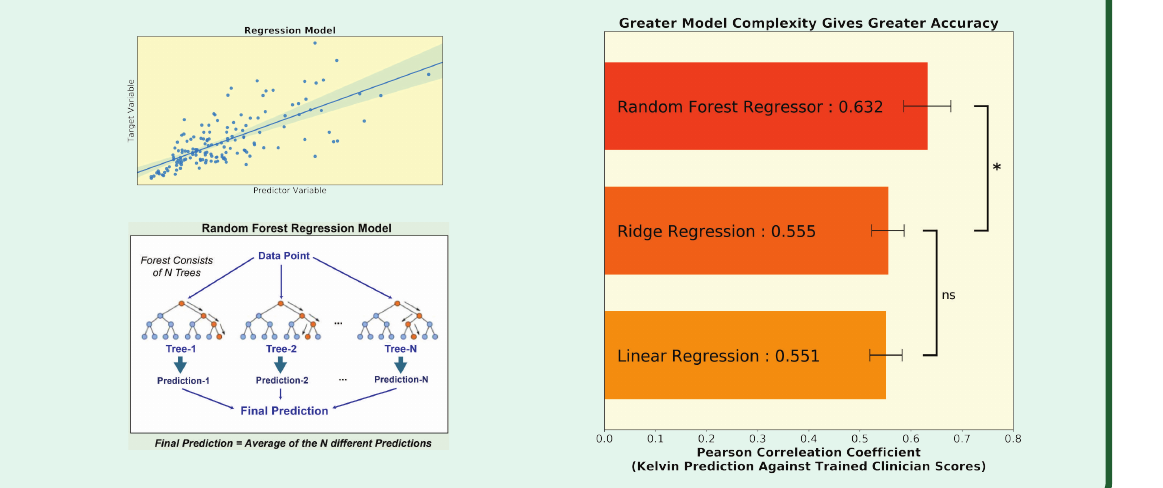
Figure 6: schematics of a linear regression model and of a random forest regression model that averages the predictions of N trees, alongside a bar chart in which the random forest regressor reaches a Pearson correlation of 0.632 against trained clinician scores, significantly above ridge regression at 0.555 and linear regression at 0.551, which do not differ significantly from each other.
Figure 6

Results

Machine learning models were trained to estimate disease severity from videos of UPDRS motor assessments. For each model presented here the results were highly significant, with over 95% of predictions being close (+/− 1) to the severity score assigned by a trained UPDRS assessor.
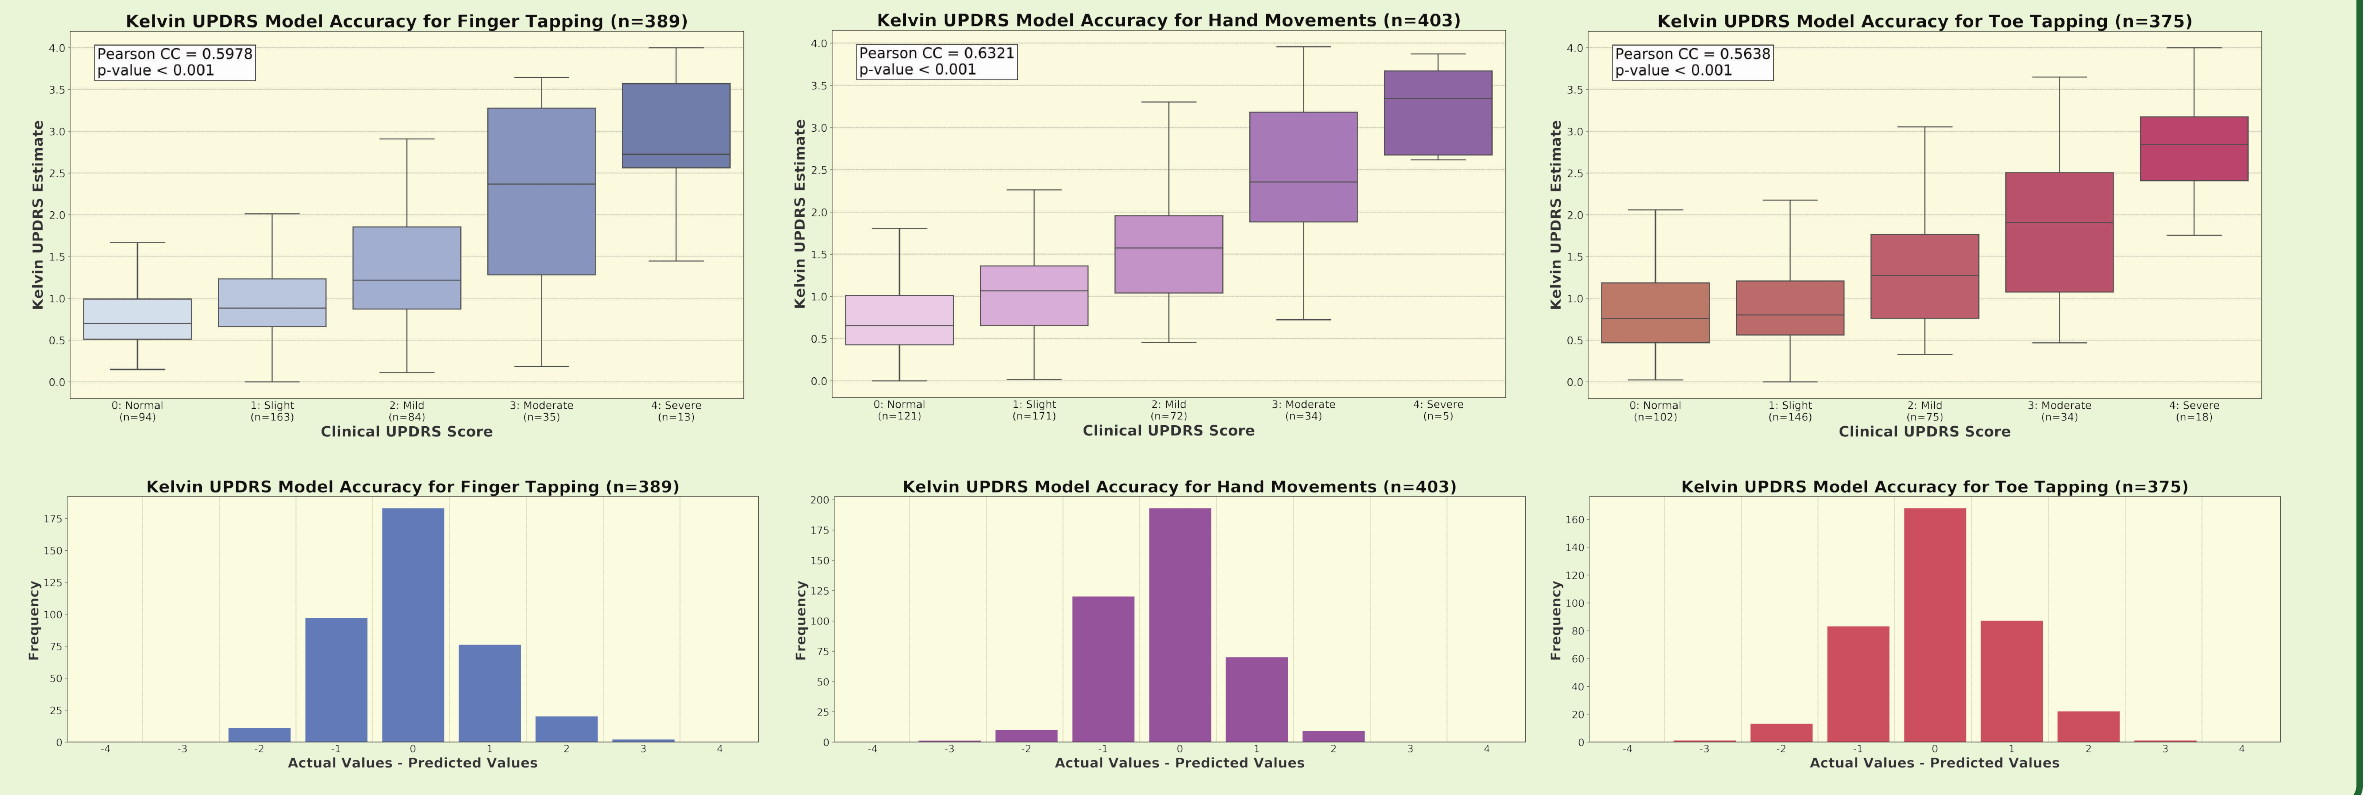
Figure 7: for each of finger tapping, hand movements and toe tapping, a boxplot of the Kelvin UPDRS estimate against the clinical UPDRS score rising steadily across the five severity levels, with Pearson correlations of 0.5978, 0.6321 and 0.5638 respectively, and a histogram of actual minus predicted values sharply peaked at zero.
Figure 7

Conclusions

These results show that KELVIN-PD is able to capture and extract the pathological signal through monocular video clips, demonstrated by highly significant correlations with scores provided by trained human assessors. Furthermore, it was demonstrated that the use of more powerful models enables improved performance over simple approaches, such as linear regression. Future efforts will concentrate on developing superior modelling approaches, across more assessment types, and using larger data sets.

About this poster

This research was originally presented as a poster by Machine Medicine Technologies. This HTML version has been reformatted for accessibility and web presentation, while preserving the content of the original poster.