Poster · 2021
Maximising UPDRS information while minimising assessment time
G. Morinan, J. Tang and J. O’Keeffe
Objective
The gold standard for measuring disease severity in PD (Parkinson’s Disease) is the MDS-UPDRS (Movement Disorder Society – Unified PD Rating Scale).1 However, the assessment is complex and time consuming, limiting its deployability in clinical practice and research. We aim to simplify the assessment methodology, while maximising the clinical information that is captured. This promises to facilitate applications such as remote, asynchronous home assessment, by reducing the burden on patients while still enabling high quality clinical management.
Background
The MDS-UPDRS consists of 50 questions and motor examinations, typically taking around 30 minutes to complete. It is known that the UPDRS contains redundancy and could be shortened without significant loss of information.2 Previous work proposed an 8-item simplification based upon clinical expertise.3
Methods
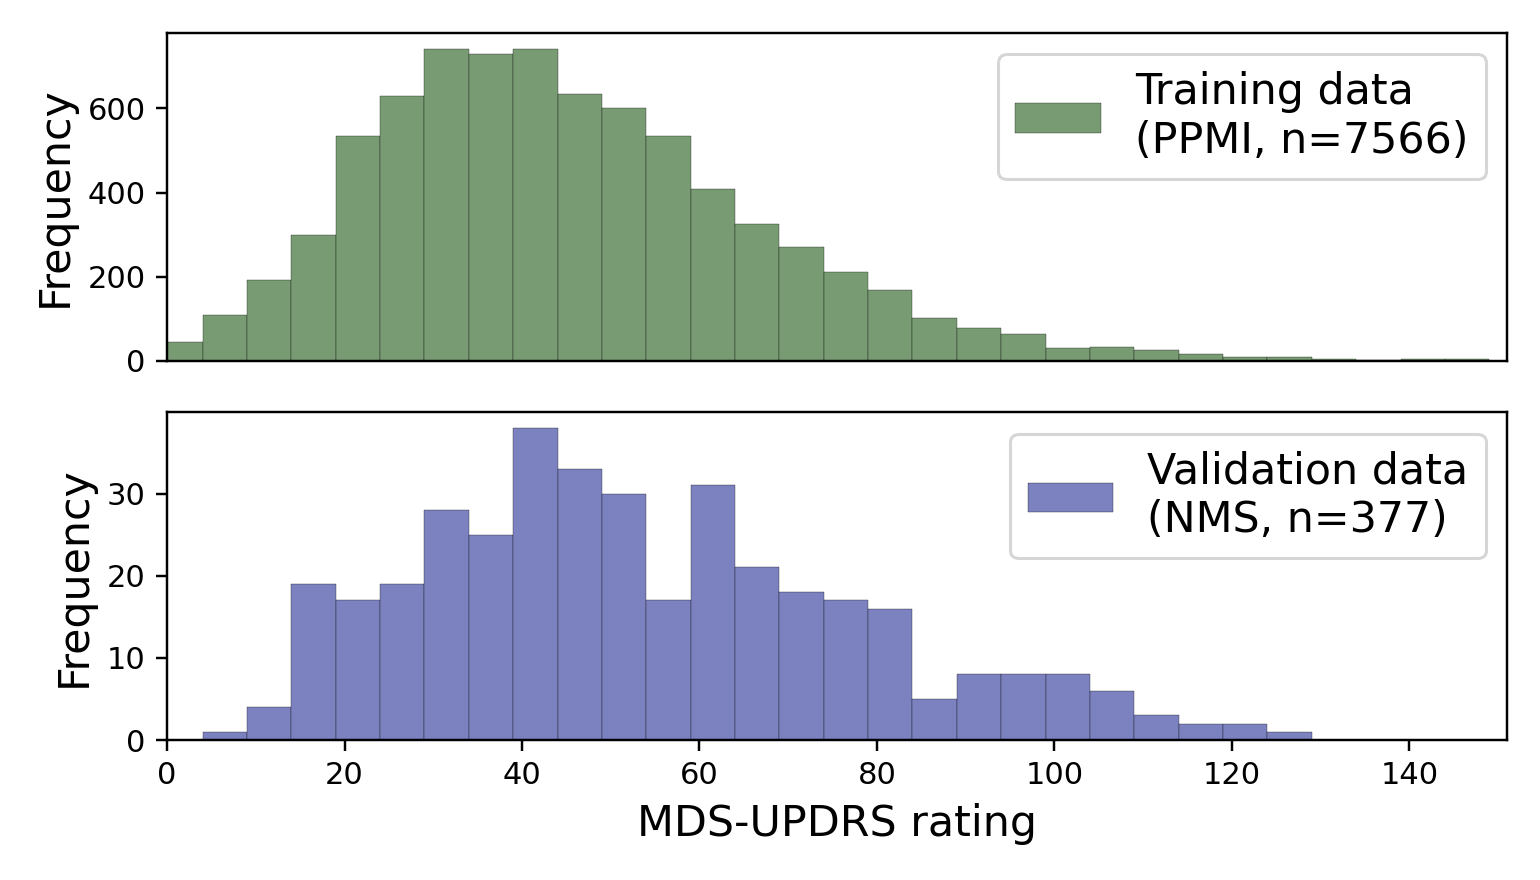
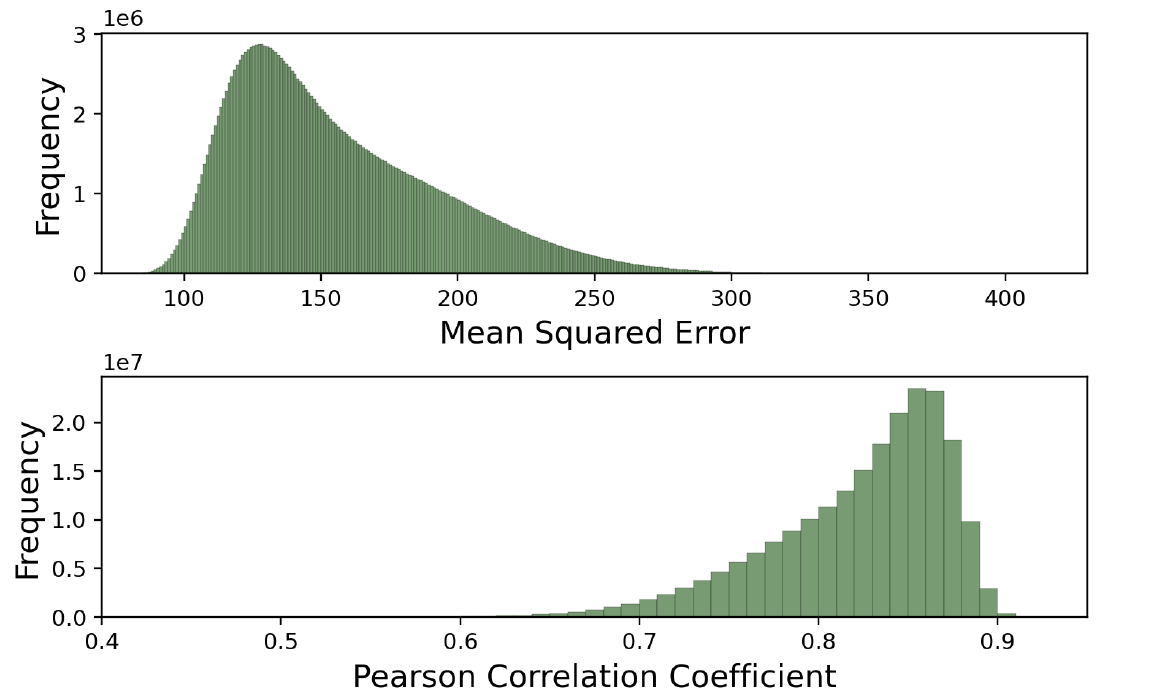
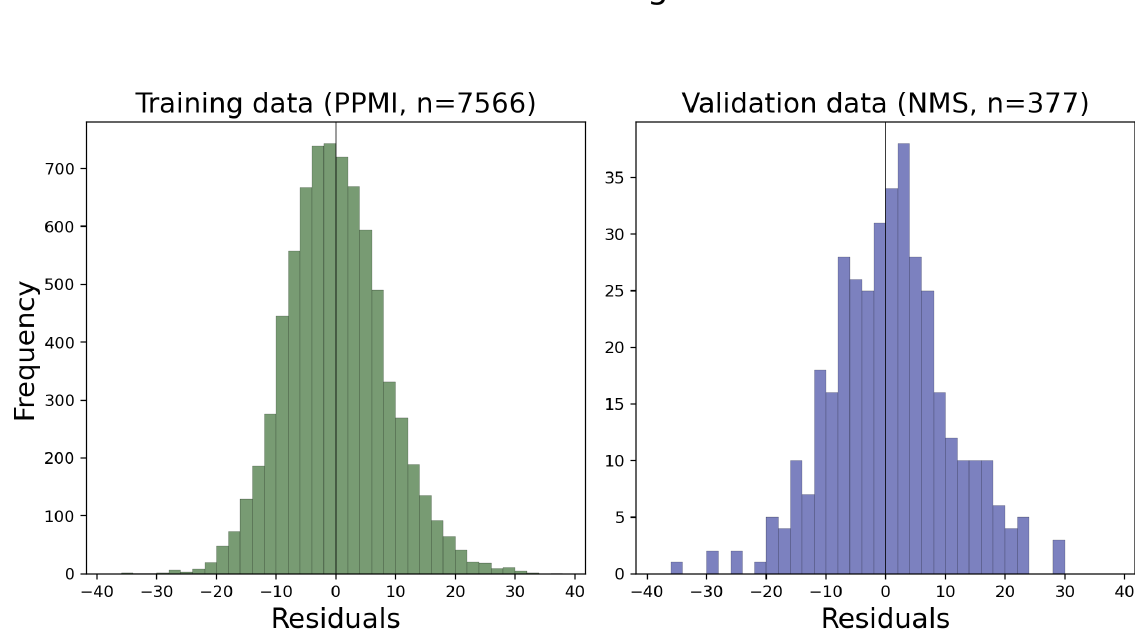
Through an exhaustive computational search, we identified an 8-item subset that minimises information loss when compared to the 50 items, while being constrained to not include items that may be difficult for a home assessment (such as gait, which requires a long corridor). Information loss was measured by the correlation between the rating estimated by a linear regression model that utilised the 8-item scores, and the full assessment rating. This used a dataset of 7,566 assessments, collected through the Parkinson’s Progression Markers Initiative.
Results
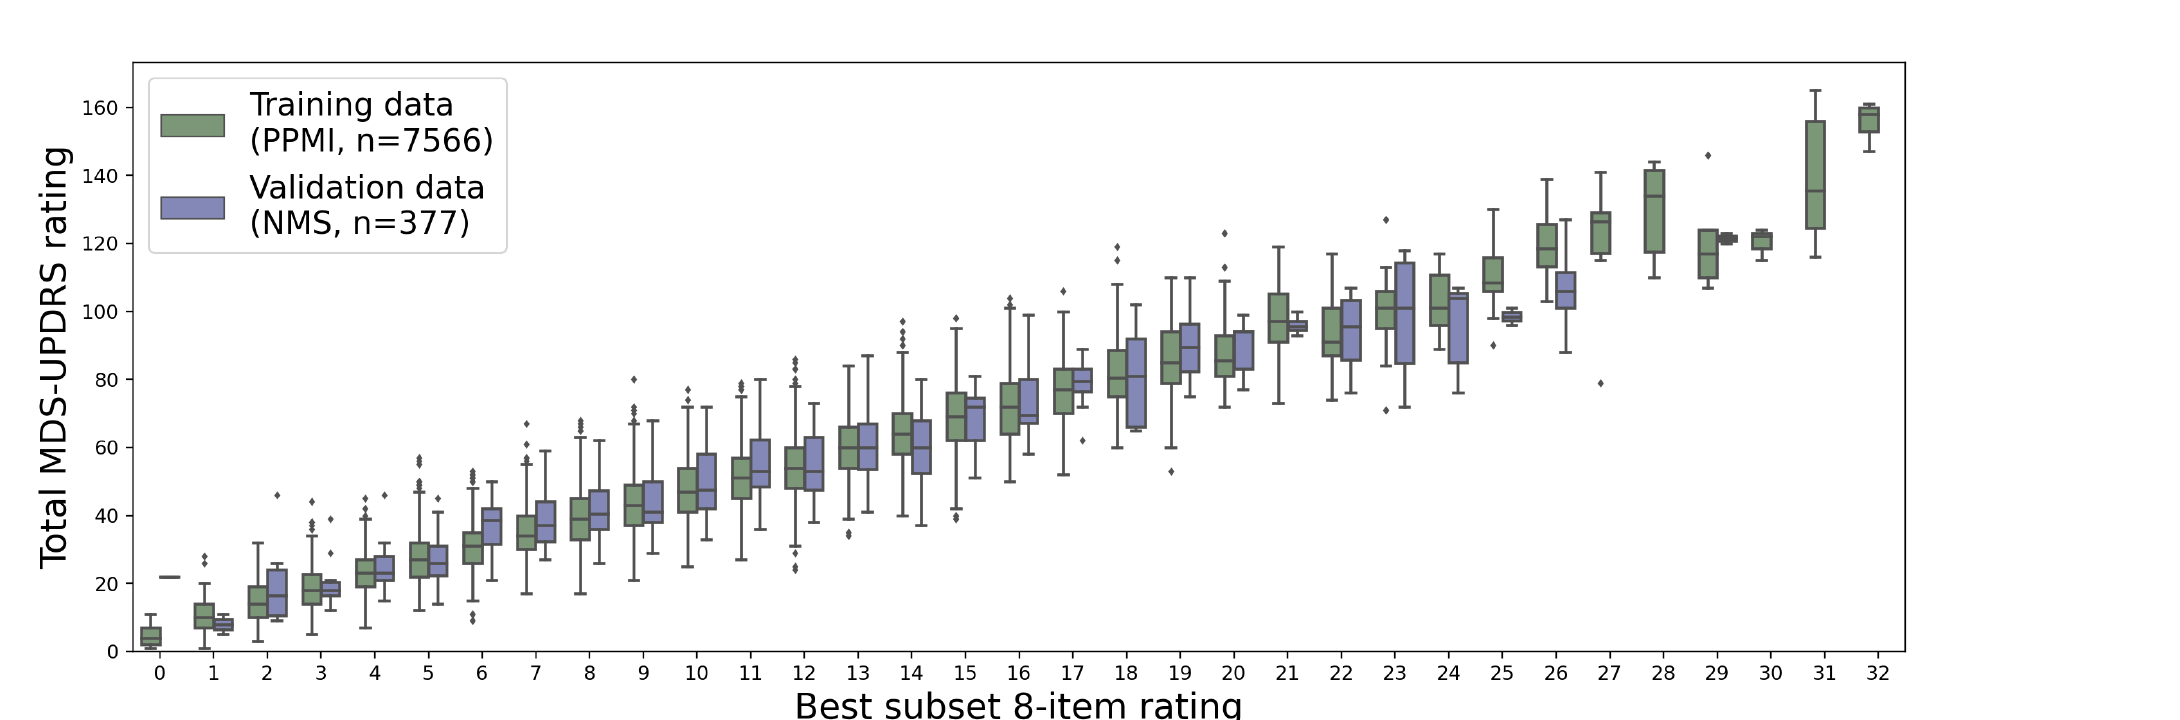
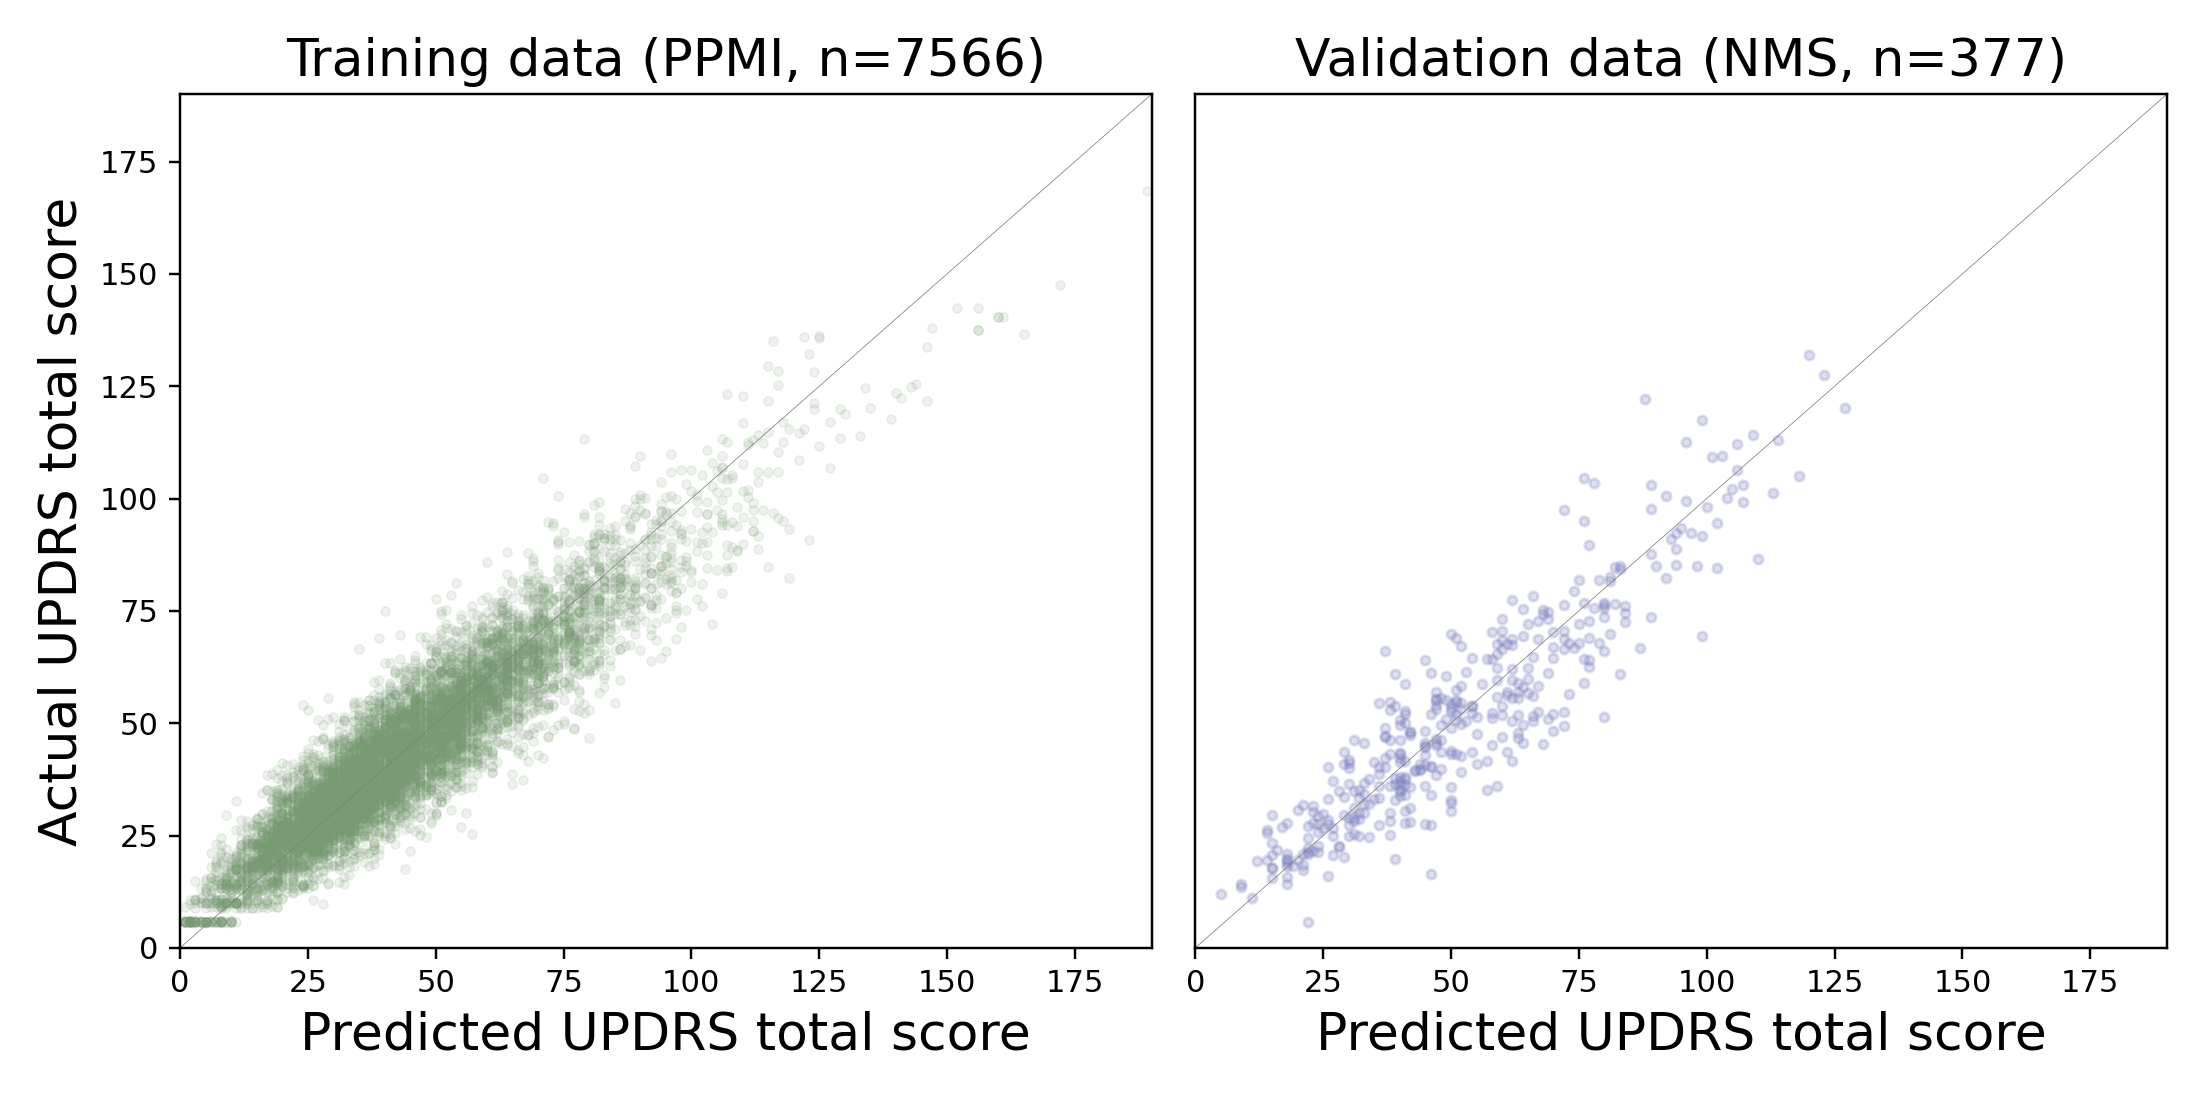
The 8-item subset identified contained three motor examination items (3.2 Facial Movement, 3.5 Hand Movements, 3.7 Toe Tapping) and five questions (1.13 Fatigue, 2.5 Dressing, 2.10 Tremor, 2.12 Walking and Balance, 4.3 Time Spent in the Off State). Correlation between the 8-item rating and the full 50-item UPDRS rating was highly significant (Pearson’s r = 0.920, p-value < 0.001). This was validated on an unseen dataset of 377 assessments, collected by the MDS. For this dataset the correlation between the 8-item rating and the full 50-item UPDRS rating was also highly significant (Pearson’s r = 0.90, p-value < 0.001).
Conclusions
We demonstrate an 8-item subset identified using computational statistics retains the vast majority of information contained within the full 50-item UPDRS. Further work will involve implementing digital tools that enable remote simplified UPDRS assessment using this 8-item subset. We estimate that for the vast majority of PD patients this assessment can be completed in 5–10 minutes.
References
- Goetz, C. G. et al. Movement Disorder Society-sponsored revision of the Unified Parkinson's Disease Rating Scale (MDS-UPDRS): scale presentation and clinimetric testing results. Movement Disorders 23, 2129–2170 (2008).↑
- Van Hilten, J. J. et al. Rating impairment and disability in Parkinson's disease: evaluation of the Unified Parkinson's Disease Rating Scale. Movement Disorders 9, 84–88 (1994).↑
- Hauser, R. A. et al. The UPDRS-8: a brief clinical assessment scale for Parkinson's disease. International Journal of Neuroscience 122, 333–337 (2012).↑
Poster Video
About this poster
This research was originally presented as a poster by Machine Medicine Technologies. This HTML version has been reformatted for accessibility and web presentation, while preserving the content of the original poster.