Back to Research

Poster · 2020

Real Time Quality Control for Subjective Endpoints in Clinical Trials

Morinan G, Peng Y, O’Keeffe J

Objective

Here we present a system which is capable of performing nearly-real time monitoring of UPDRS part-3 motor assessments using a combination of multidimensional statistics and computer vision.

Background

The development of neurotherapeutics is often reliant on subjective end-points. These are subject to issues such as inter-rater and intra-rater variability, rater bias, rater drift or simply poor quality assessment. Consequently quality control is a major concern for those performing clinical trials in this field, and has led to costly innovations such as central rating. Intelligent systems, so-called A.I., are of great interest in this regard because they offer the prospect of an automated “second opinion” in real time, which does not suffer from the problems associated with subjectivity.

Methods

Firstly, a large data-set of over 15,000 UPDRS part-3 assessments was used to characterise a high dimensional feature space, induced by treating a part-3 assessment as a 33 element feature vector. Using a specific distance metric as a test statistic this allowed a p-value to be allocated to a part-3 assessment immediately and in real time.

Secondly, computer vision was used to analyse videos and estimate the correct UPDRS score, allowing a second p-score to be allocated on the basis of this independent analysis within a few minutes of an assessment being completed.1 Combining these two filters results in a highly sensitive system, which could be used to vastly reduce the cost of quality control by focusing attention onto those assessments which appear to be highly improbable, under the assumption of high quality and consistent rating.

Results

The system was validated using a high quality video and rating data set, collected across multiple clinical sites and scored by trained assessors, which we were able to artificially “corrupt”. The system was shown to be both sensitive and specific for detecting “corrupted” assessments.

Conclusions

To our knowledge this system represents the first near-real time intelligent quality control system, which it is apparent could be extended to encompass many more subjective endpoints in this and other conditions.

Figures
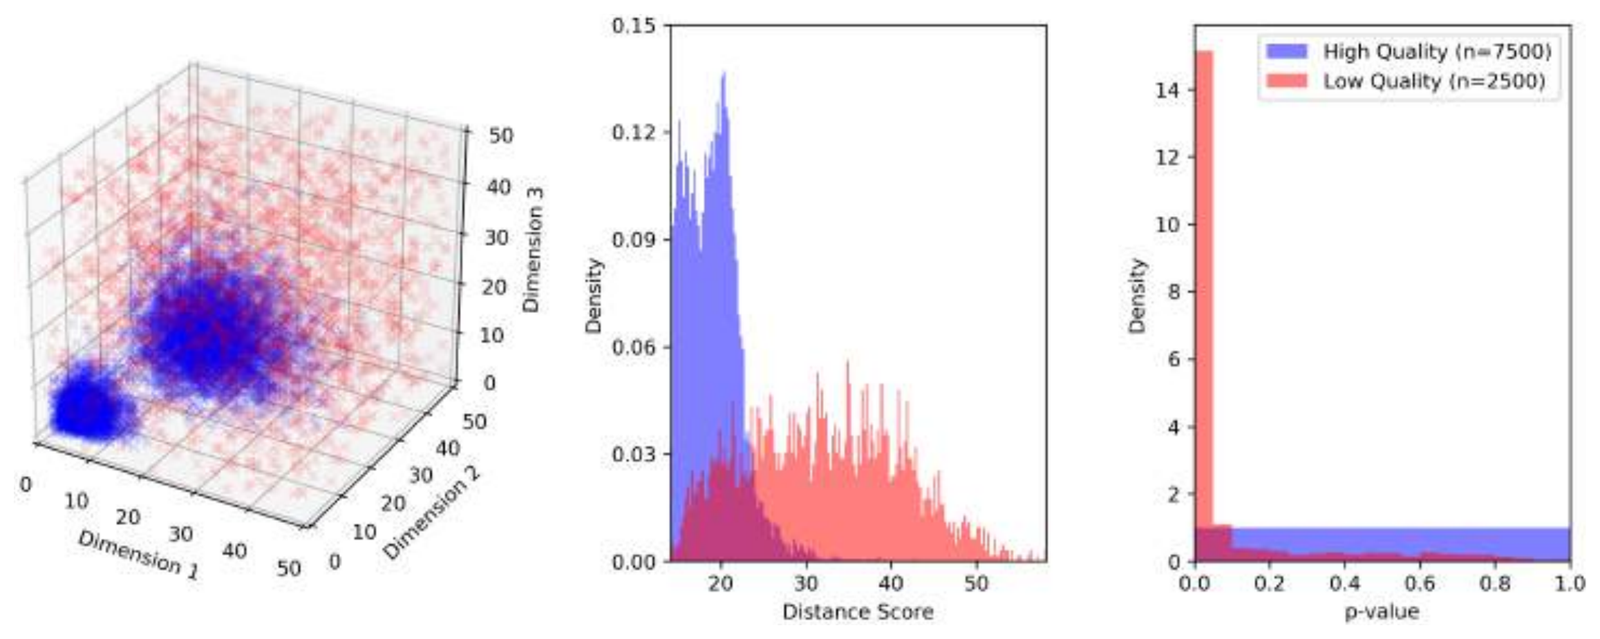
Figure 1: a three-panel illustration on a synthetic three-dimensional dataset. The left panel shows dense blue clusters of authentic data within a diffuse red cloud of uniform random low-quality data. The middle panel shows the two distance-score distributions overlapping but clearly divergent, with authentic data centred near 20 and low-quality data spread from 25 to 50. The right panel shows p-values: uniform for authentic data and sharply concentrated near zero for low-quality data.
Figure 1. Illustration of the approach using a synthetic, three dimensional, “toy” dataset. (Left panel) “Authentic” high-quality data (in blue) is sampled from a highly non-uniform, bimodal distribution, while “inauthentic” low-quality data is drawn from a uniform random distribution. (Middle panel) By computing the average distance of any data point to all the examples of authentic data, a distribution over distances is obtained. By chance some low-quality data falls within the clusters of authentic data, but most does not, resulting in overlapping but divergent distributions of distances, interpretable as similarity scores. (Right panel) Finally, from the distribution over distance for authentic data a p-value can be computed. The majority of low quality data points are assigned a low p-value, while the p-values for authentic data are (by definition) uniformly distributed.
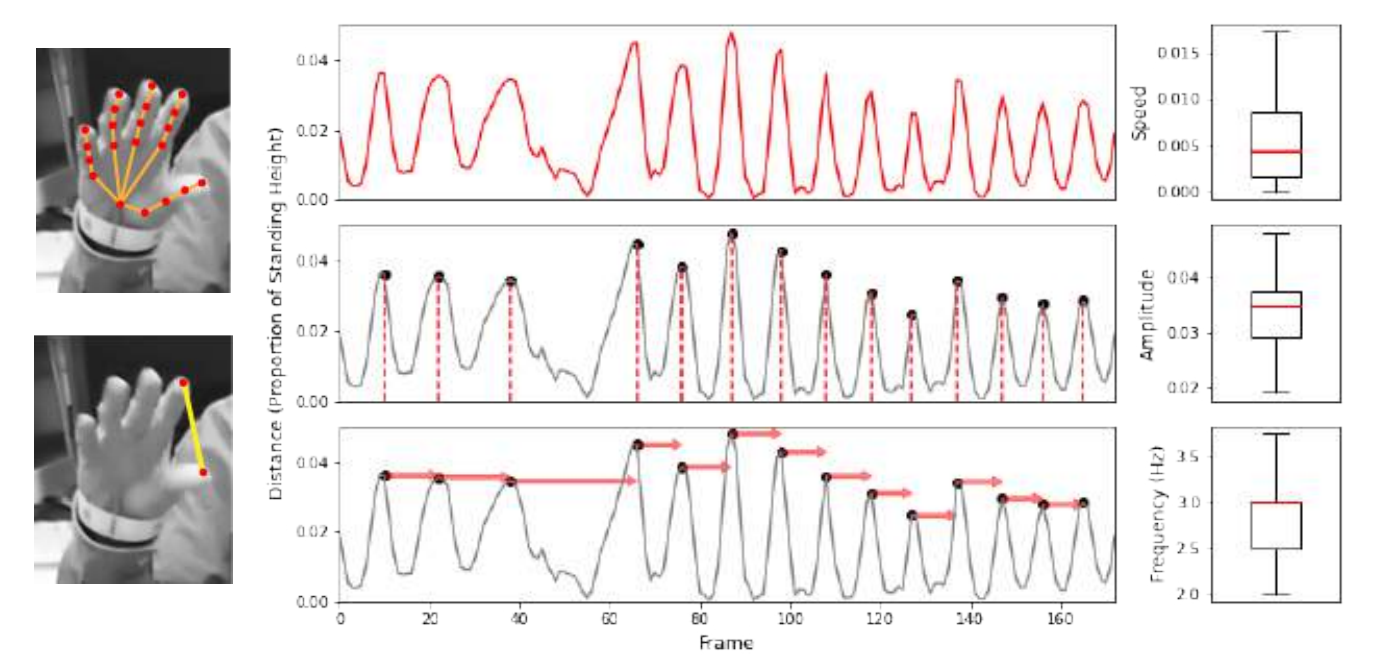
Figure 2: computer vision analysis of a finger tapping video. Two stills show hand keypoints and the measured thumb-to-finger distance. Three stacked traces of that distance over about 170 frames show the raw signal, detected peaks, and the intervals between peaks, with boxplots summarising the resulting speed, amplitude and frequency features.
Figure 2. Computer Vision Analysis (CVA) on video of a patient performing the UPDRS assessment finger tapping task. (Upper left panel) Hand keypoints are identified using OpenPose.1 (Lower left panel) Distance between finger tip and thumb tip is measured for each frame, (middle panel) enabling the construction of timeseries signals, (right panel) from which key features of speed, amplitude and frequency can be measured. Similar CVA is applied to each task of the UPDRS, with feature extraction tailored for the specific action being performed.
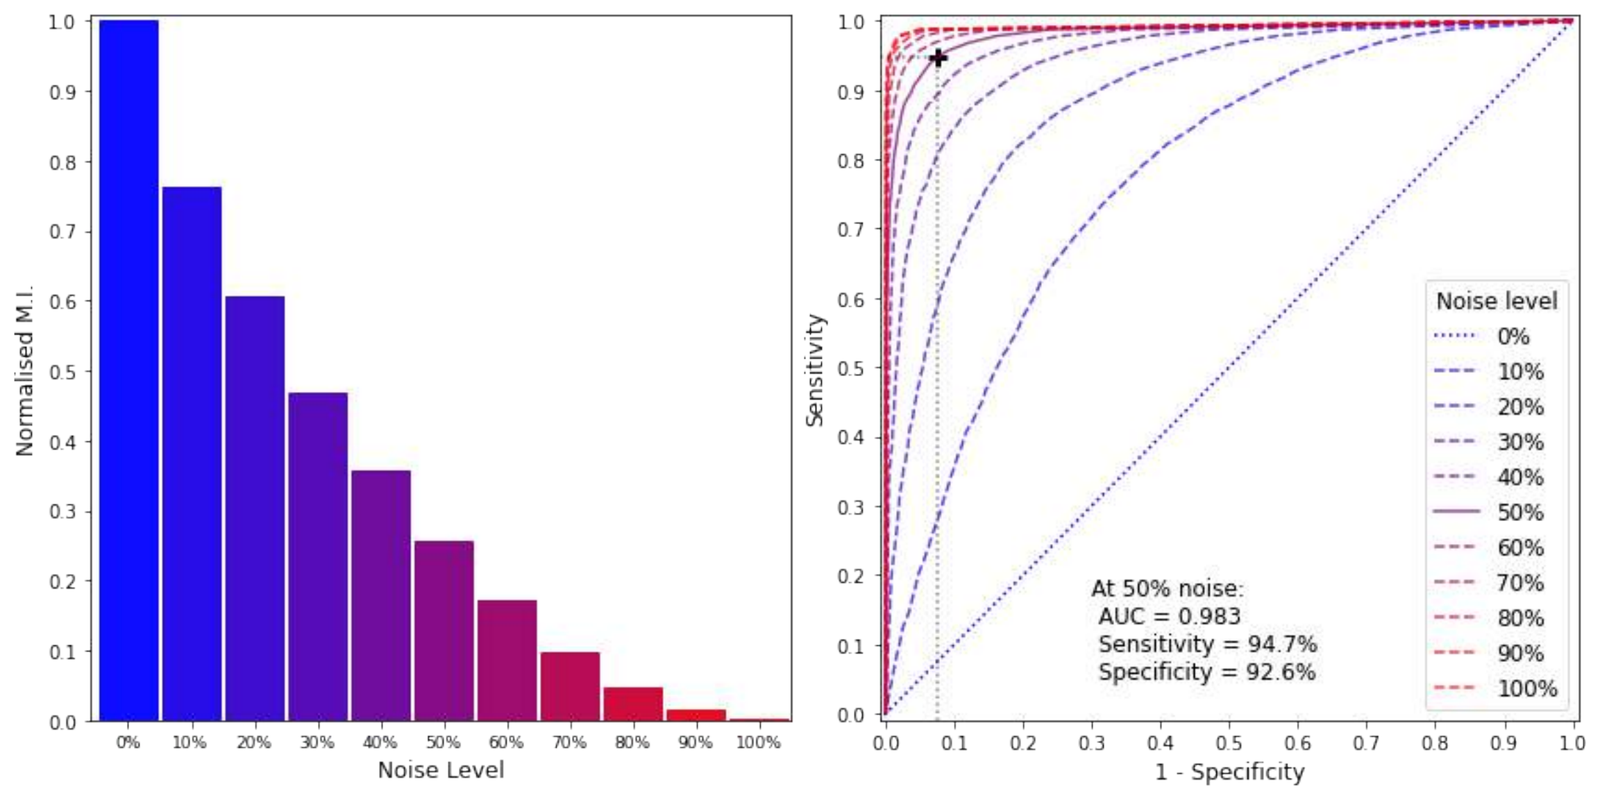
Figure 3: a bar chart of normalised mutual information falling steadily from 1.0 at 0% noise to nearly zero at 100% noise, and a family of ROC curves for each noise level, with the 50% noise curve marked at a sensitivity of 94.7% and specificity of 92.6% for an area under the curve of 0.983.
Figure 3. (Left panel) Normalised MI (mutual information) between the PPMI dataset2 and inauthentic data generated by a noise model, where a noise level of 50% gives an output whereby half of all values in the authentic dataset have been replaced with random values drawn uniformly; as such the higher the noise level the less naturalistic the output. (Right panel) This data is used to test the system, the performance of which is seen in the Receiver Operating Characteristic (ROC) curves for different noise levels; a noise level of 50% results in an Area Under the Curve (AUC) of 0.983, specificity of 92.6% and sensitivity of 94.7% (given a significance threshold of 5%).
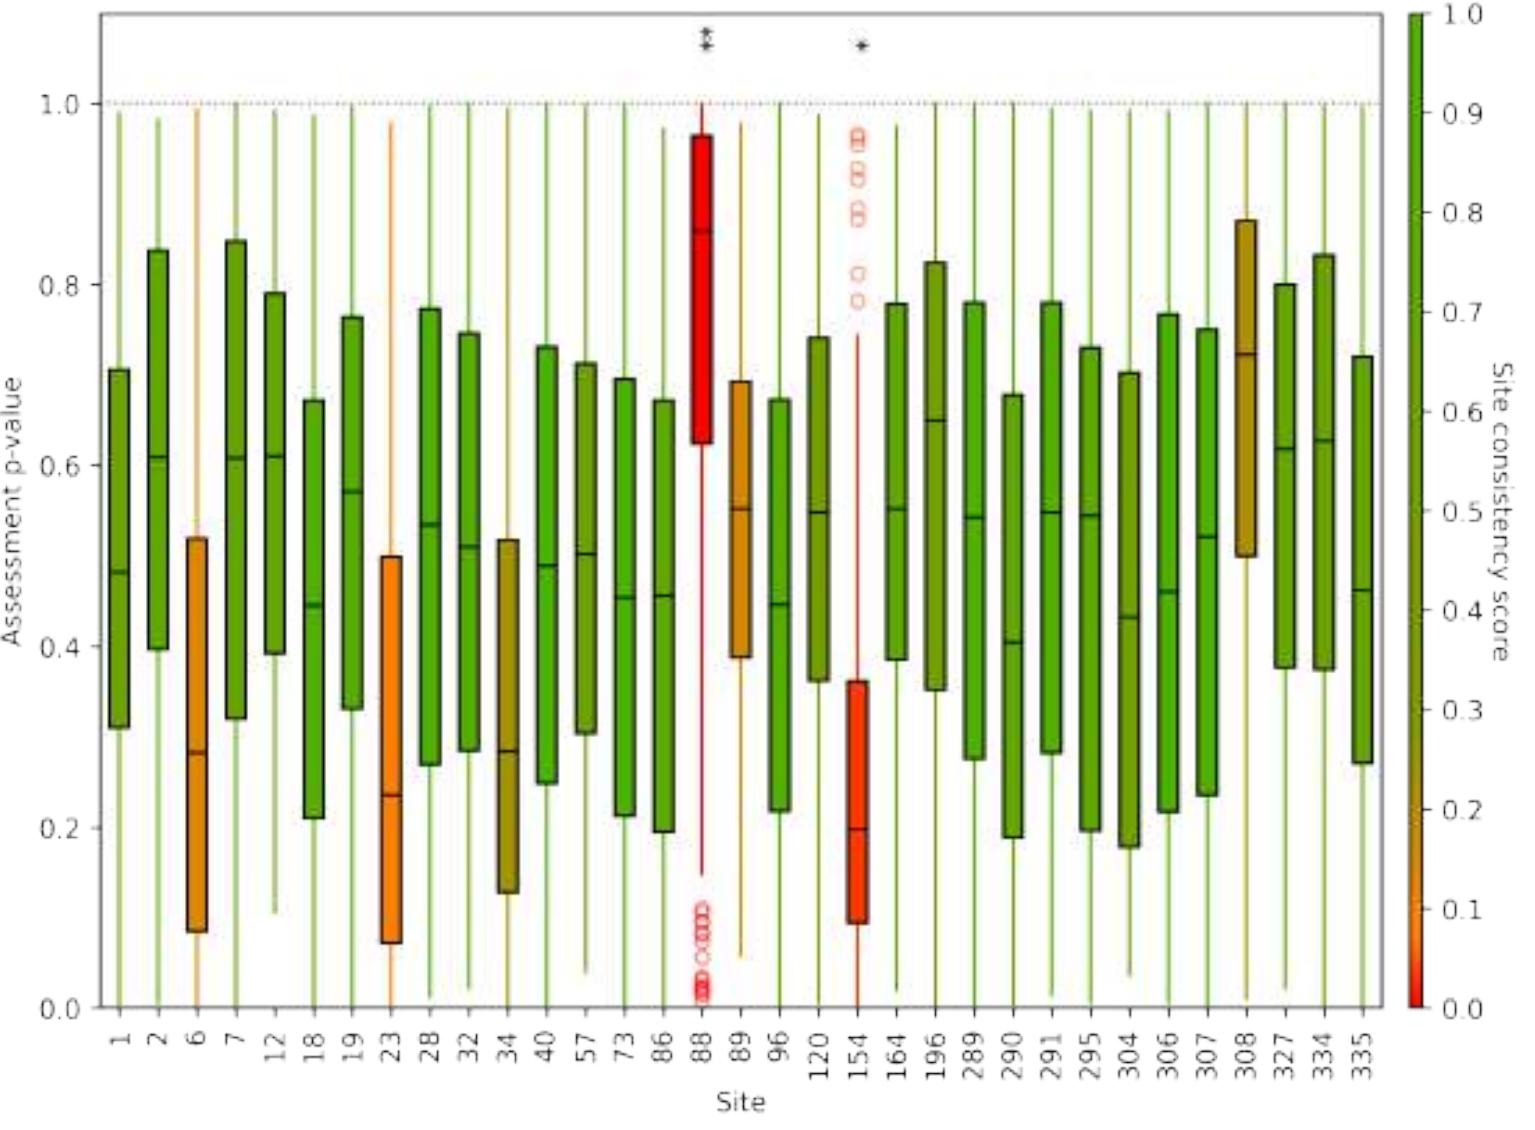
Figure 4: boxplots of assessment p-values for 33 PPMI sites, coloured from green for a high site consistency score to red for a low one. Most sites are green with medians between 0.2 and 0.6, while sites 88 and 154 stand out in red, one with unusually high p-values and one with unusually low.
Figure 4. Side-by-side comparison of 33 participating sites in the PPMI database.2 Colours from red to green represent the value of the site consistency score (test statistic) based on the distribution of p-values. This allows sites to be considered under the null hypothesis of similarity across all sites, yielding site specific p-values. Significance levels are denoted * (0.01 < p < 0.05), ** (0.001 < p < 0.01). With multiple comparisons we would expect to find 1.65 of 33 sites to exceed the significance threshold of 5%, which sites 88 & 154 do.
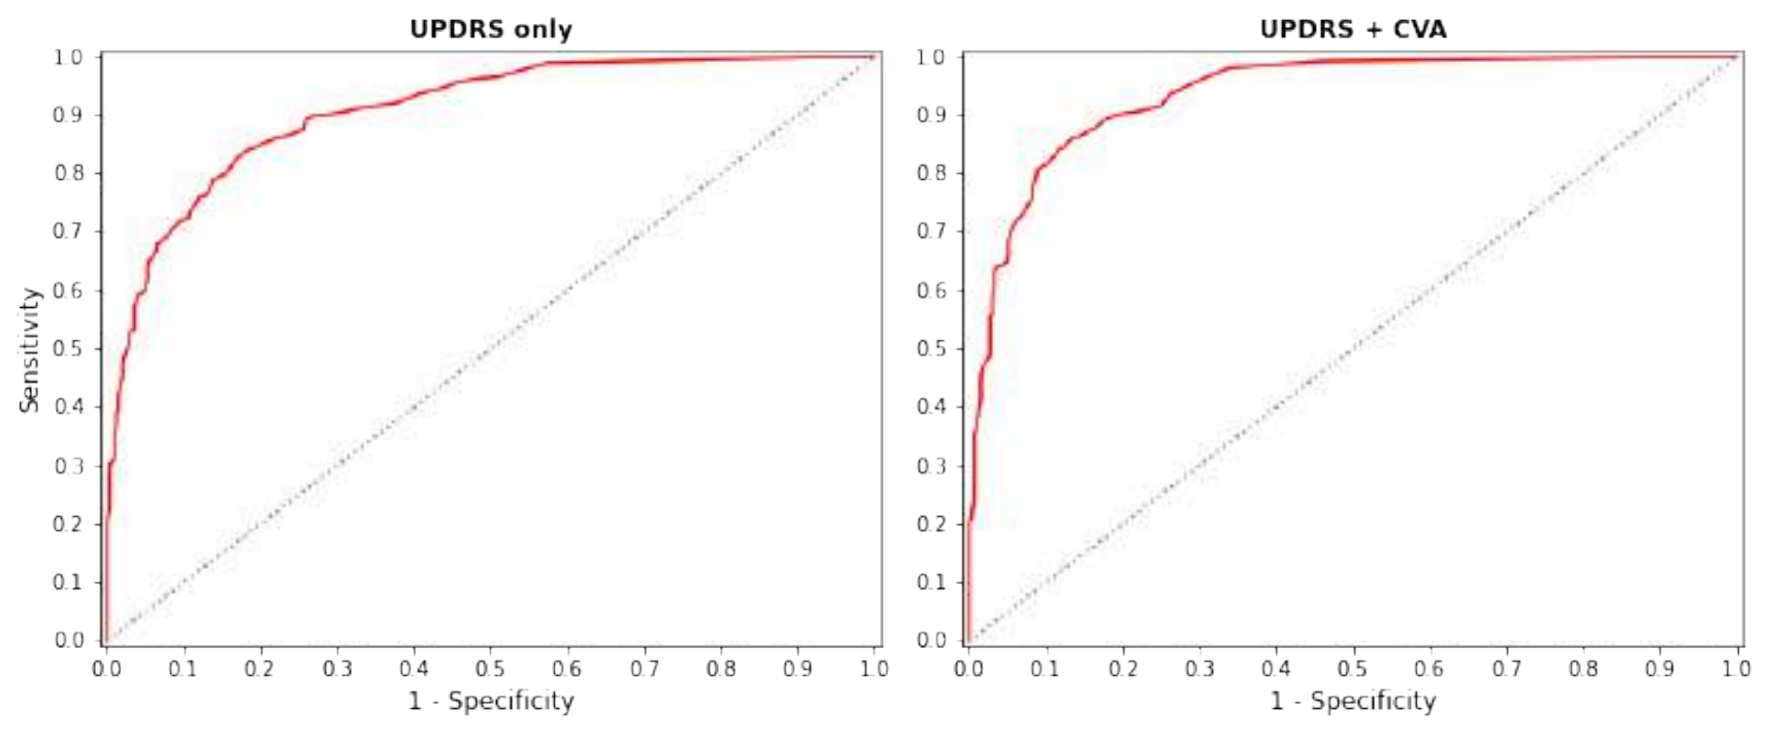
Figure 5: two ROC curves. Using UPDRS scores alone the curve rises steeply to a sensitivity of about 0.9 by a false positive rate of 0.2; adding computer vision analysis lifts the curve further, reaching about 0.95 at the same point.
Figure 5. ROC curves showing the performance of the system when distinguishing authentic data (n = 341) from inauthentic data generated from a noise model at a 50% noise level. (Left panel) Performance using only UPDRS scores is lower (AUC = 0.907 < 0.937) when compared to the using both (right panel) UPDRS scores and CVA from the video data.
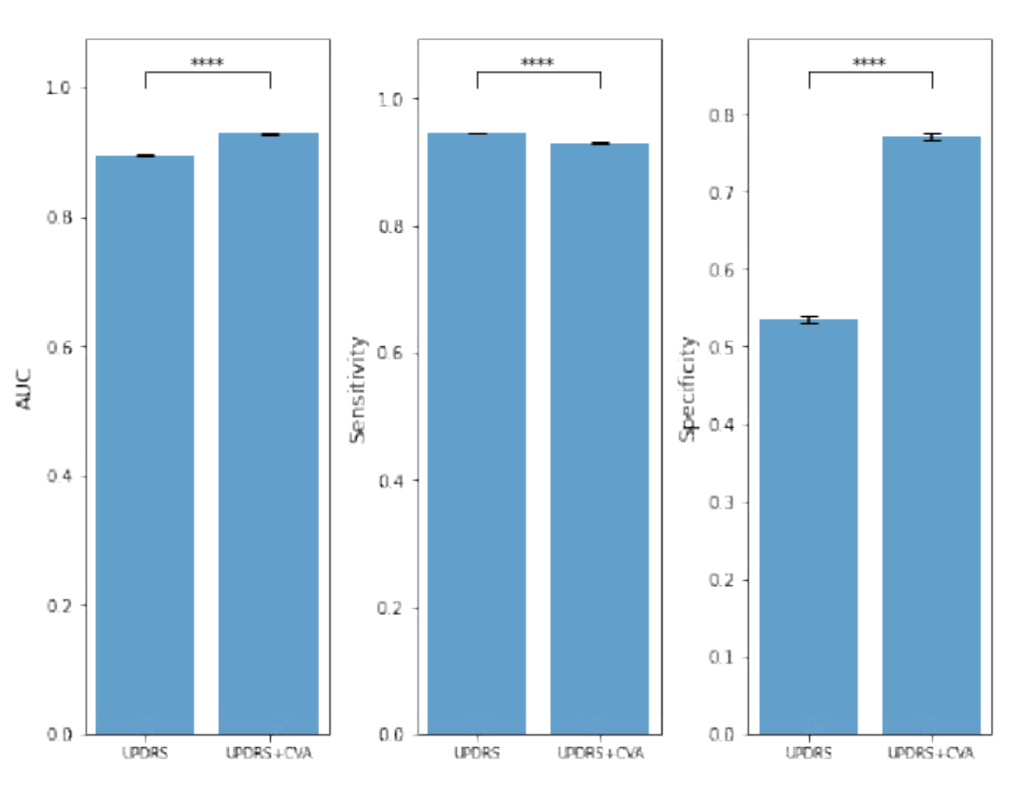
Figure 6: three bar charts comparing UPDRS alone with UPDRS plus computer vision analysis. Average AUC rises from about 0.89 to 0.93, sensitivity falls slightly from about 0.94 to 0.93, and specificity rises sharply from about 0.53 to 0.77, each difference marked as significant at p below 0.0001.
Figure 6. Comparison of UPDRS based and UPDRS + CVA based results. (Left panel) The average AUC, (middle panel) sensitivity and (right panel) specificity of results are shown (for a significance threshold of 5%), with the error bars indicating the standard error. We see a significant change in performance (**** denoting p < 0.0001) with the addition of the CVA; the specificity increases by a large amount while sensitivity reduces slightly. A helpful intuition is that the CVA is able to identify false positives.

Conclusion

These results demonstrate a non-parametric system that can distinguish authentic from inauthentic data. This can be applied on a macro scale and in real-time to identify clinical sites where the data may be inconsistent. The addition of a computer vision analysis improves performance through a direct assessment of source data, rather than just derivative data such as clinical ratings.

References

  1. Cao, Z., Hidalgo Martinez, G., Simon, T., Wei, S. & Sheikh, Y. A. OpenPose: realtime multi-person 2D pose estimation using Part Affinity Fields. IEEE Transactions on Pattern Analysis and Machine Intelligence (2019).↑a↑b
  2. Marek, K., Jennings, D., Lasch, S., Siderowf, A., Tanner, C., Simuni, T., Coffey, C., Kieburtz, K., Flagg, E., Chowdhury, S. et al. The Parkinson Progression Marker Initiative (PPMI). Progress in Neurobiology 95(4), 629–635 (2011).↑a↑b

About this poster

This research was originally presented as a poster by Machine Medicine Technologies. This HTML version has been reformatted for accessibility and web presentation, while preserving the content of the original poster.