Intelligence-Based Medicine · 2021
Computer-Vision Based Method for Quantifying Rising from Chair in Parkinson’s Disease Patients
Gareth Morinan, Yuwei Peng, Samuel Rupprechter, Rimona S. Weil, Louise-Ann Leyland, Thomas Foltynie, Krista Sibley, Fahd Baig, Francesca Morgante, Ro’ee Gilron, Robert Wilt, Philip Starr and Jonathan O’Keeffe
Abstract
Background: The ability to arise from a sitting to a standing position is often impaired in Parkinson’s disease (PD). This impairment is associated with an increased risk of falling, and higher risk of dementia. We propose a novel approach to estimate Movement Disorder Society Unified PD Rating Scale (MDS-UPDRS) ratings for “item 3.9” (arising from chair) using a computer vision-based method, whereby we use clinically informed reasoning to engineer a small number of informative features from high dimensional markerless pose estimation data.
Methods: We analysed 447 videos collected via the KELVIN-PD™ platform, recorded in clinical settings at multiple sites, using commercially available mobile smart devices. Each video showed an examination for item 3.9 of the MDS-UPDRS and had an associated severity rating from a trained clinician on the 5-point scale (0, 1, 2, 3 or 4).
The deep learning library OpenPose was used to extract pose estimation key points from each frame of the videos, resulting in time-series signals for each key point. From these signals, features were extracted which capture relevant characteristics of the movement; velocity variation, smoothness, whether the patient used their hands to push themselves up, how stooped the patient was while sitting and how upright the patient was when fully standing. These features were used to train an ordinal classification system (with one class for each of the possible ratings on the UPDRS), based on a series of random forest classifiers.
Results: The UPDRS ratings estimated by this system, using leave-one-out cross validation, corresponded exactly to the ratings made by clinicians in 79% of videos, and were within one of those made by clinicians in 100% of cases. The system was able to distinguish normal from Parkinsonian movement with a sensitivity of 62.8% and a specificity of 90.3%. Analysis of misclassified examples highlighted the potential of the system to detect potentially mislabelled data.
Conclusion: We show that our computer-vision based method can accurately quantify PD patients’ ability to perform the arising from chair action. As far as we are aware this is the first study estimating scores for item 3.9 of the MDS-UPDRS from singular monocular video. This approach can help prevent human error by identifying unusual clinician ratings, and provides promise for such a system being used routinely for clinical assessments, either locally or remotely, with potential for use as stratification and outcome measures in clinical trials.
Keywords — Parkinson’s disease; arising from chair; time series analysis; computer vision; pose estimation; machine learning
1. Introduction
Parkinson’s disease (PD) is an increasingly common neurological condition, affecting 1% of those ages over-60.1 Axial motor impairments, including difficulties arising from sitting to standing, are common in patients with PD.2,3 These difficulties are associated with being unable to turn over in bed,2 increased risk of falling,4,5 decreased functional independence,6 as well as being a predictor for dementia in PD.3
The gold standard to evaluate motor impairment in PD patients is the Movement Disorder Society-sponsored revision of the Unified Parkinson’s Disease Rating Scale (MDS-UPDRS).7 The MDS-UPDRS is used by clinicians to rate a patient on a 5-point scale for a variety of items, with “item 3.9” (arising from chair) being used to measure the ability to arise from a sitting to a standing position (see Table 1). However, despite the guidance that accompanies the scale, this can be a relatively subjective measure, that is poorly quantified with wider inter-rater variability that requires trained personnel in order to score accurately.8
A common method to more formally quantify the action of arising from chair is through sensors, such as magneto-inertial sensors,9 motion sensor and force plates,10 or through complex motion analysis systems in laboratory settings.11 Although technologies allowing objective measurement of movement, such as accelerometers, have been available for multiple decades, they have not been widely adopted by clinicians.12,13 Cost and ease of use are important, and technologies which require additional equipment (and its associated maintenance and cost) are unlikely to be embraced by practitioners in the clinic, even if they would provide analytical superiority. Knowledge and concerns around expertise in using and integrating such technologies were one of the most commonly reported hindrances to the successful adoption of clinical decision support systems.14
Meanwhile, mobile computing devices are now widely used, with an ever increasing proportion of the population being familiar with their operation. The cost of these devices, which generally include video recording capabilities, along with video conferencing has decreased sharply in recent years, leading to their more widespread availability. This opens up tremendous potential for telemedicine for the assessment of patients with PD.15
Magneto-inertial sensors have been used to detect the difference between PD patients and healthy subjects,9 while multi-camera motion analysis systems have been used to distinguish successful and failed sitting to standing attempts,11 but these technologies have not hitherto been used to estimate MDS-UPDRS ratings for arising from a chair. Computer vision has however already been used to estimate the severity of PD symptoms as it relates to bradykinesia and gait,16,17,18,19,20,21 including our own ongoing work.22,23
Here, using a dataset of videos collected during routine MDS-UPDRS assessments at five different clinical sites, we trained a model to estimate specific MDS-UPDRS item scores. We show how the model (a) achieves high accuracy, showing good agreement with assessors’ scores, and (b) can be used to identify cases in which raters likely mislabelled the data — beyond any expected disagreement between different assessor.
Because of the potential inter-rater variability in MDS-UPDRS ratings, it is not uncommon for clinicians to diverge from one another by 1 point on the UPDRS.24 Given this, a computer system able to estimate these ratings, and provide a real-time ‘second opinion’, has the potential to be useful for automated quality control, and/or to reduce the clinical subjectivity. This is of particular interest for clinical trials, where rater bias or rater drift can negatively impact on the quality of data collection and trial outcomes.25,26,27
We propose a novel approach to estimate scores of the MDS-UPDRS item 3.9 ‘arising from chair’, in patients with PD, using a computer vision-based method requiring only a single monocular video. This can be recorded using the camera of a consumer smartphone or tablet in standard clinical settings. Our approach provides the opportunity for automated quality control and could potentially be used for remote home assessment for patients with PD in clinical trials or for routine clinical follow-up.
2. Methods
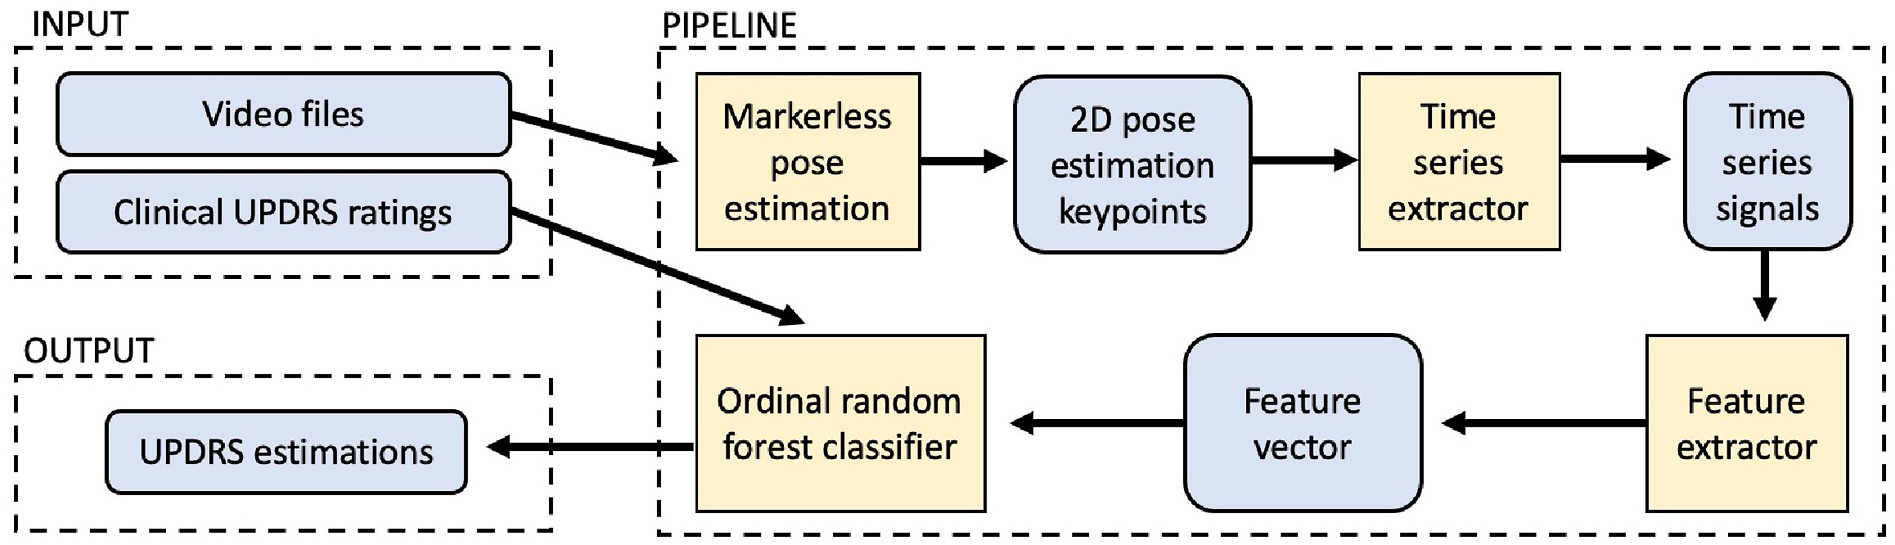
Our end-to-end pipeline of the system is shown in Figure 1; the inputs are videos and UPDRS ratings from clinics (Section 2.1), which feed into a pipeline consisting of keypoint detection (Section 2.2), time-series signal extraction (Section 2.3), feature selection (Section 2.4) and finally the classification model (Section 2.5) which outputs estimates of UPDRS ratings (Section 3.2).
2.1. Data
Videos were recorded using the KELVIN-PD™ mobile application and then collected on the KELVIN-PD™ motor assessment platform developed by Machine Medicine Technologies.23,28 Data was collected by experienced nurses, neurologists and researchers, performing UPDRS assessments of PD patients, at the five largest sites currently using this platform (see Table 2). These patients ranged across the spectrum of severity of PD, as indicated by variation in “UPDRS part-3” score (which is the sum of the clinician ratings for all 18 items of the motor examination section of the MDS-UPDRS). The patient populations of different sites were broadly similar in severity, as indicated by having the same median Hoehn and Yahr stage29 (another system for measuring PD progression).
Here we focused on 447 consecutive video recordings of UPDRS item 3.9 assessments (arising from chair).7 No manual selection of videos took place; therefore the data accurately reflects the current state of clinical data routinely collected at these institutions.
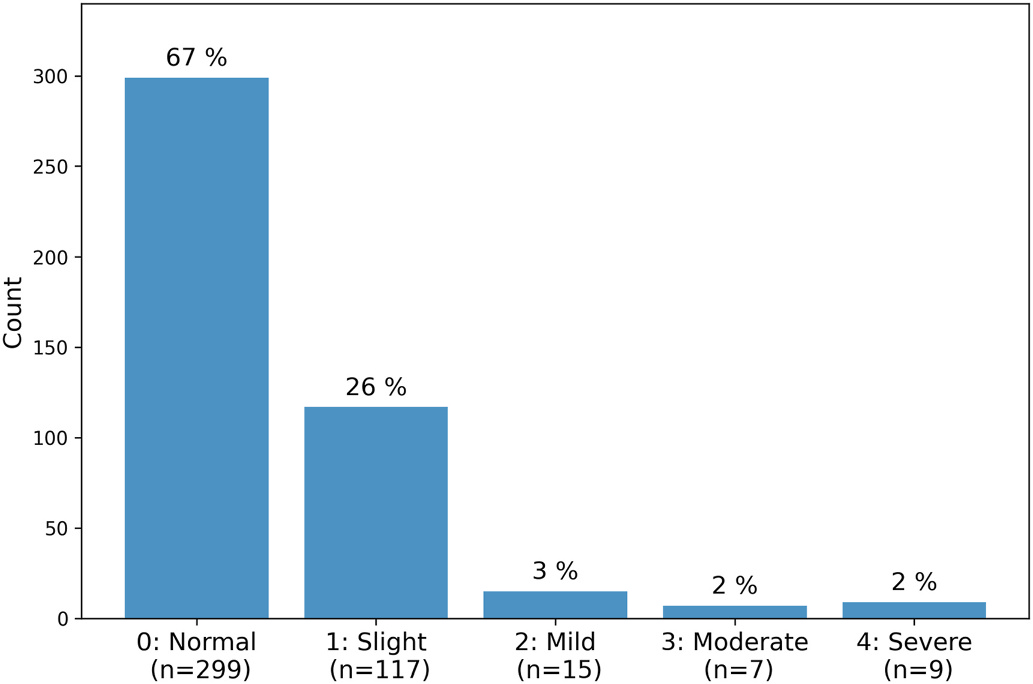
Assessors rated patients’ performance with a severity of “normal” (rating 0, n = 299), “slightly impaired” (rating 1, n = 117), “mildly impaired” (rating 2, n = 15), “moderately impaired” (rating 3, n = 7), or “severely impaired” (rating 4, n = 9) (see Figure 2 and see Table 1 for the description of each rating).
Video clips were labelled manually (Y.P.), which included identifying the frames during which the sitting to standing action was being attempted, and labelling whether or not the patient used their hands to help push themselves up during the action (which would then give them a score of 2 or higher). From inspecting the videos it was noted that for 147 of the 447 examinations the patient was sat on a chair that did not have arm rests. The MDS-UPDRS instructions state the chair used by the patient should have arm rests (see Table 1), however we chose to include all 447 examinations in our dataset because this reflects how examinations are being conducted in practice.
2.2. Body keypoints
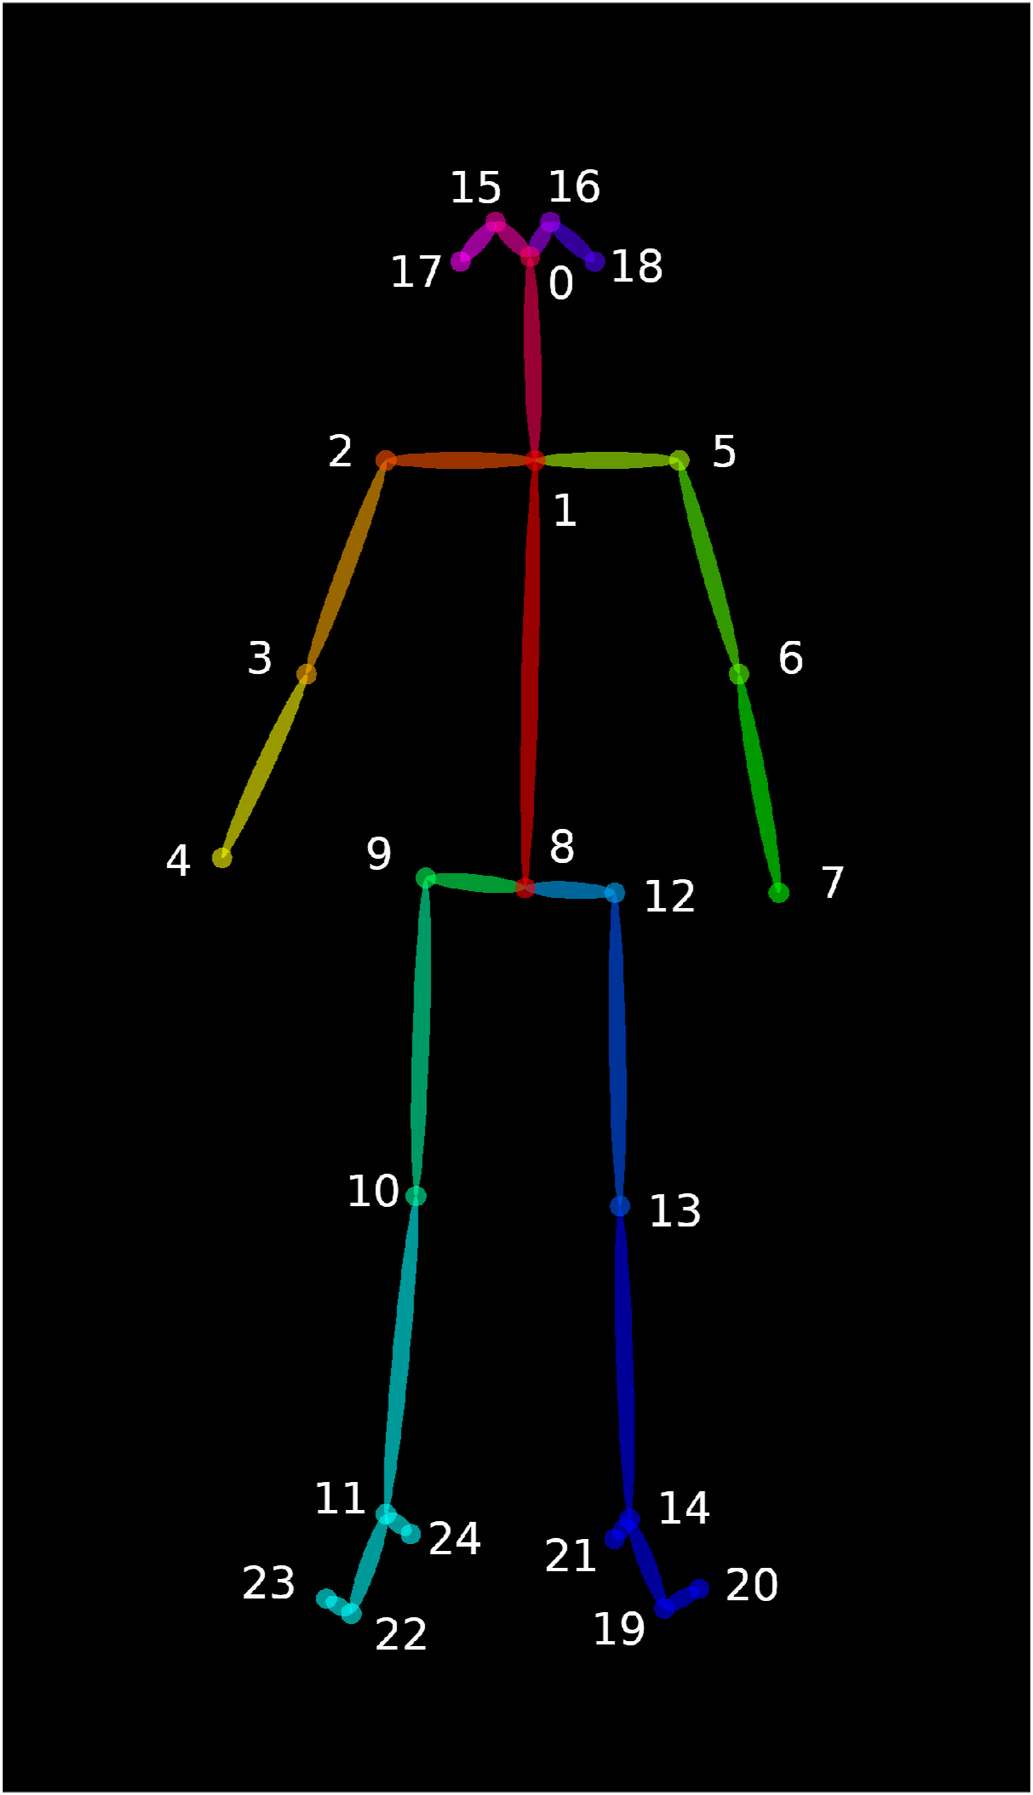
Pose estimation data, consisting of 25 keypoints per frame, were extracted from video using version 1.3 of OpenPose, deep-learning system for identifying 2D-keypoints of persons within an image31 (see Figure 3). It is one of the most widely used and tested markerless pose estimation systems available, the OpenPose GitHub repository has been forked over 6000 times and has dozens of contributors.32
OpenPose was chosen because of its robust approach to multi-person keypoint detection, which utilises a two-branch multi-stage Convolutional Neural Network; one branch provides confidence maps in order to identify body parts, while the other branch provides affinity fields in order to link body parts of individuals. Reliable multi-person detection is necessary for our application given that both the patient and clinician may appear in UPDRS examination videos, for instance when a patient with a more severe condition requires assistance in moving. The output given by OpenPose allows us to consistently isolate the patient, such that the clinician’s movements do not interfere with our system.
2.3. Signals
The keypoint coordinates estimated for each frame were used to construct two time-series signals for each video intended to capture the key movements of the patient during the arising from chair action. These signals are defined below using the following notation. Pi is the 2D positional vector of the ith keypoint. H is the estimated standing height of the patient (see Height Estimation Supplement). Pi,j denotes the midpoint between the ith and jth keypoints.
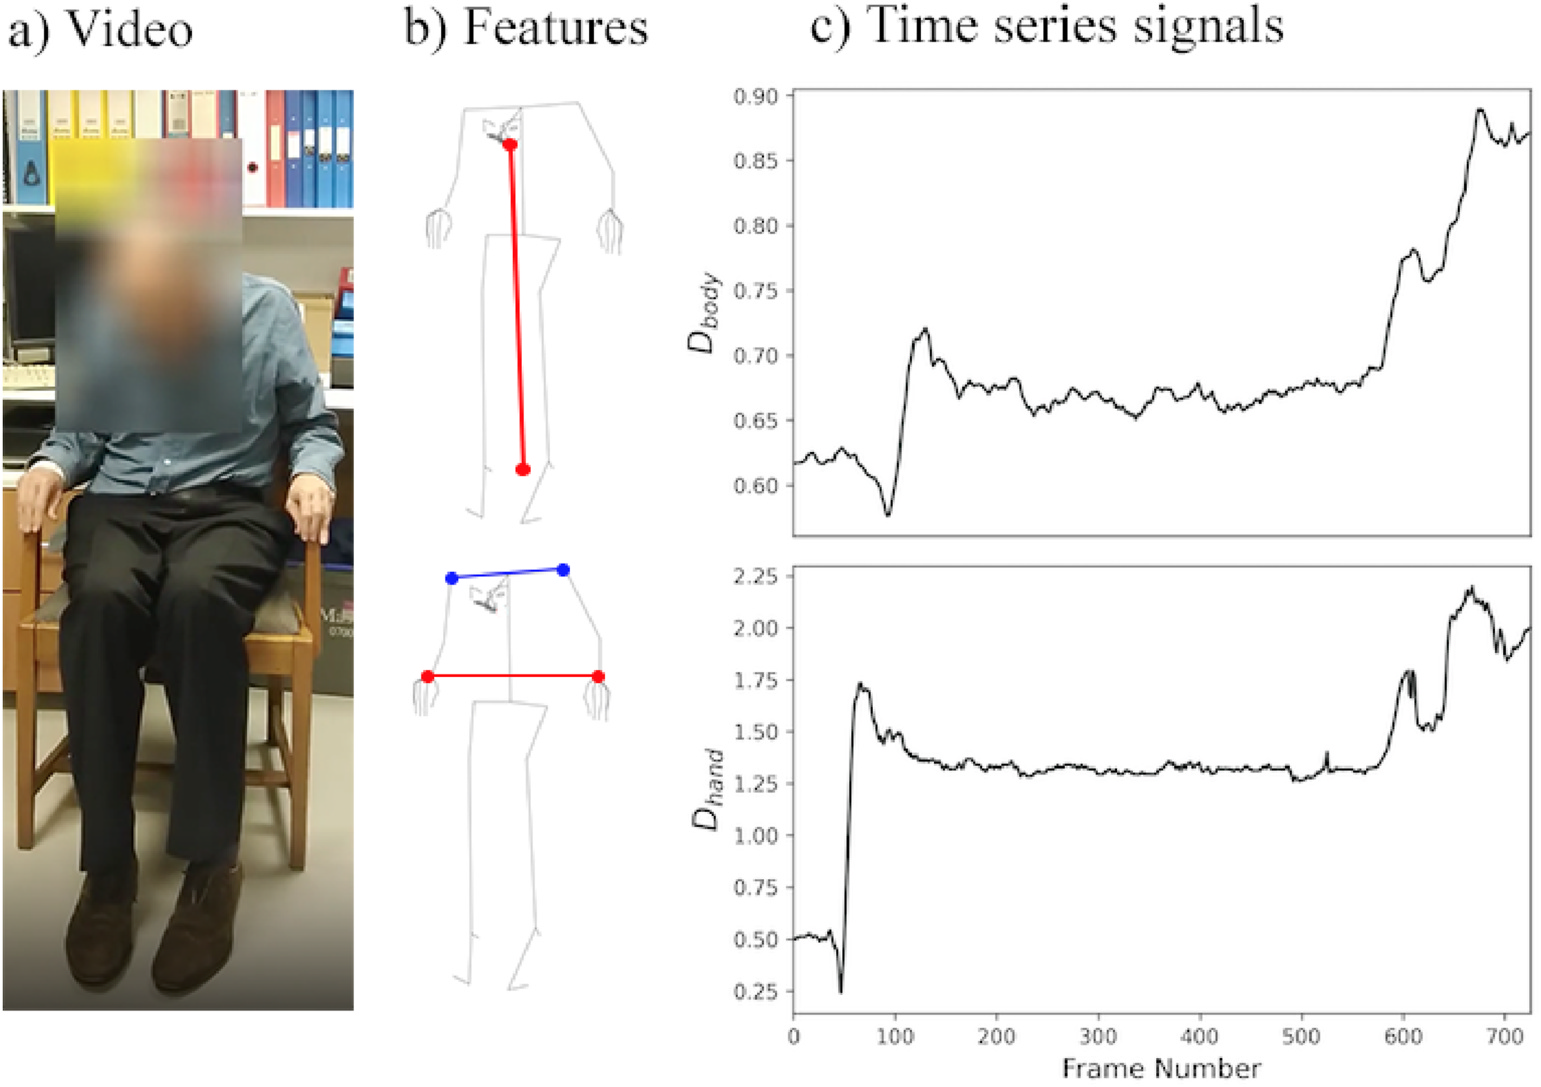
The normalised distance of the body (Dbody) measures the Euclidean distance between the nose and the midpoint of the two ankles (Figure 4), defined as:
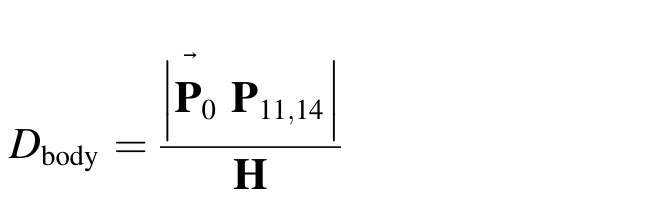
As the patient stands up, the value of Dbody increases. If a patient can fully stand up, then we would expect the value of Dbody to be close to 1.
The ratio of the distance of the hands (Dhand) measures the Euclidean distance between the two wrists divided by the Euclidean distance between the shoulders (Figure 4), defined as:
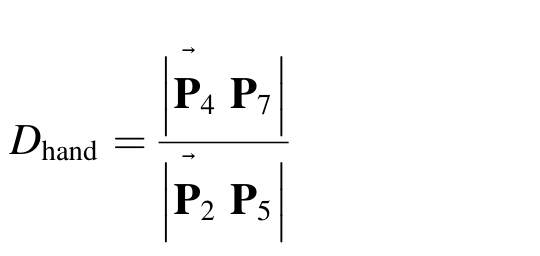
The larger this ratio, the more likely it is that the patient used their hands to assist themselves during the movement. Patients who do not use their hands to assist themselves have their hands placed on the chest, such that they are much closer together compared to if the hands are placed on the arms of the chair.
2.4. Feature extraction
From the two signals described in Section 2.3, four features were extracted, intended to capture key characteristics of the examination listed in the MDS-UPDRS manual (Table 1). Three numerical features were extracted from Dbody, and one binary feature was extracted from Dhand (see Table 3).
σ is the standard deviation of the velocity, where velocity is the absolute first difference of the Dbody defined as:

for i in {0, …, n − 1}, where di is the value of Dbody at the ith frame, and n is the total number of frames of the video.
This feature corresponds to the parts of the manual which states patients who score a 1 “may need more than one attempt” and those who score a 3 “may have to try more than one time using the arms of the chair”. σ indirectly measures number of attempts, because the more attempts a patient makes, the higher the proportion of the video they spend sat down between attempts, and hence the less the variation in the velocity.
The body distance percentage change (C) denotes the difference in the 0.99 quantile (q0.99) and 0.01 quantile (q0.01) of Dbody divided by the 0.01 quantile of Dbody. The feature is defined as:

The quantiles were chosen instead of the minimum/maximum to account for possible noise in the pose estimation, which can create an artificial spike in the Dbody signal. Because videos are recorded in clinical settings, such noise can occur due to poor lighting, shaking cameras, crowded background or other non-optimal conditions. This feature relates to the part of the manual which states patients should be “sitting back in the chair” while attempting to stand. From observing the videos in the data set we found that in general patients who were unable to stand while “sitting back” would lean forward before attempting to stand again, because leaning forward helps balance while standing. A larger value of C indicates that the patient had to lean forward before attempting to stand. However, it is also the case that videos of severe patients who were unable to fully stand, would have a small value of C. As such C is not a simple linear feature but rather one that must be considered within the context of the other feature values, hence why we use a non-linear model framework.
The percentage jerk is the median of the jerk divided by the acceleration, defined as:
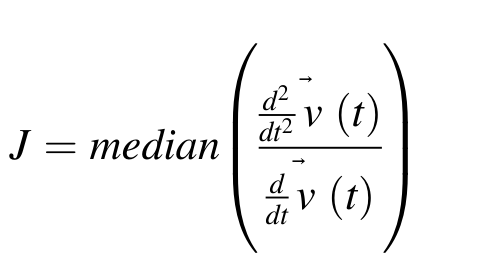
This feature relates to the part of the manual which states a patient should score a 0 if they are able to “arise quickly without hesitation”. J indirectly measures this. Smooth signals have low jerk, whereas high jerk indicates a lack of smoothness which in this context indicates the patient hesitated made while attempting to stand.
The binary feature (U) indicates if the patient used their hands to push themselves up from the chair. This corresponds to the part of the manual which instructs assessors to score the patient a 2 or higher if the patient “pushes self up from the arms of the chair”.
U is computed using a logistic regression model with two classes; 1 indicates the hands were used, 0 otherwise. This model has a single input, the 0.75 quantile of the Dhand signal.
U uses the 0.75 quantile because a patient will only attempt to stand while using their hands after making several failed attempts without use of the hands. Therefore it is often the case that a patient will have their hands on their chest for the majority of a video, even for examinations where the patient ultimately places their hands on the arms of the chair. Using a quantile of 0.25 or 0.5 would mean measuring a part of the video corresponding to a failed attempt where the patient is not using their hands. Using a higher quantile, such as 0.95, would introduce the possibility of measuring noise in the pose estimation which can occur due to non-optimal video recordings (e.g. poor lighting conditions or a shaking camera).
2.5. Ordinal random forest classifier
The UPDRS consists of 5 discrete values, making regression approaches non-ideal as they are designed for estimating continuous variables. During development we found that regression models provided unsatisfactory results as they would over-predict scores of 1 (because by doing this the model minimises its loss function, the mean squared error of predictions, to the detriment prediction variance).
Most traditional categorical classification approaches are also non-ideal as they do not consider the ordering of categories. However UPDRS ratings are ordered, i.e. the similarity between 0 and 1, is greater than the similarity between 0 and 2.
Hence we chose to estimate MDS-UPDRS ratings using an ordinal classification approach, which does consider how classes are ordered. For this work we used an ordinal classification implementation that combines multiple base classifiers, each performing binary classification, that when combined can make ordinal classification.33
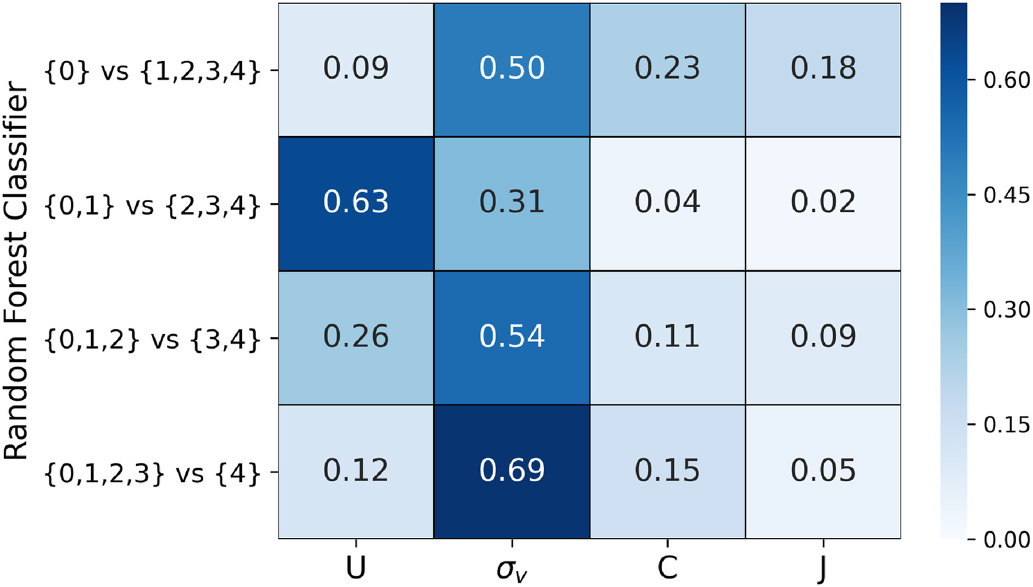
Under this ordinal classifier system, n − 1 separate base classifiers are trained, where n is the number of classes. These n − 1 classifiers are trained distinguish consecutive classes. This system is advantageous over other ordinal classification implementations because each of the n − 1 classifiers have their own set of parameters, allowing us to examine how feature importance varies between them (see Figure 7).
In our context there are five classes (UPDRS score = 0, 1, 2, 3 or 4), which means four base classifiers were trained; 0 vs 1–4, 0–1 vs 2–4, 0–2 vs 3–4, and 0–3 vs 4. This allows us to see how, for instance, one feature may be more important for distinguishing 0 vs 1–4, than it is for distinguishing 0–1 vs 2–4.
We chose to use the random forest classifier class2 from the Python library Scikit-learn34 as the base classifier. This classifier trains an ensemble of decision trees, each of which uses a different bootstrapped subset of the original dataset and a randomly selected subset of features at each node of the tree, with the final random forest prediction being the result of majority voting by all the decision trees. Each random forest classifier took the same four features as inputs (see Section 2.4). Random forests were chosen because successive nodes of decision trees are able to approximate complex interactions between features. While the ensemble of trees, and randomising the set of features considered at each node, makes the forests robustness to over-fitting. Additionally, the Gini importance of each feature can be easily computed, based upon how much each feature contributes to the reduction of the Gini impurity.35
Random forests were chosen because successive nodes of decision trees are able to approximate complex interactions between features, while the ensemble of trees makes the forests robustness to over-fitting; also using random set of features for each tree makes the trees uncorrelated from each other.
2The RandomForestClassifier used default hyper-parameters except for n_estimators = 200, max_features = ‘sqrt’, max_depth = 6, min_samples_leaf = 3 — which are the default hyper-parameters used for all RandomForestClassifier models at Machine Medicine Technologies.
2.6. Model performance measurement
Model performance was measured using estimates made by leave-one-out cross validation. Model estimates were summarised using a confusion matrix, and judged using accuracy and accuracy(±1). We used the accuracy(±1) metric, which was defined as the proportion of estimates for which the absolute residuals were one or less, in addition to the ordinary accuracy score, because it is not uncommon for clinicians to diverge from one another by 1 UPDRS point.24
In addition, we summarised model estimates by the binary confusion matrix, for which we grouped together all Parkinsonian ratings (1–4) and denoted this the ‘positive’ class, while we denoted the non-Parkinsonian rating (0) the ‘negative’ class. Primary metrics of interest were accuracy, sensitivity (the proportion of positives correctly identified), and specificity (the proportion of negatives correctly identified).
3. Results
3.1. Features
The feature U captured whether a patient used their hands to push up from the chair with an accuracy score of 99.6% (see Table 4). Two videos were misclassified. In the first video the patient was incorrectly classified as using their hands. The video was labelled as patient not using their hands, even though they put theirs hands on the legs and it is unclear if the patient pushed up from the legs.
In the second video the patient was incorrectly classified as not using their hands. The patient stood up without crossing their hands across the chest, but lifted the arm to the chest level, and pointed the forearm to the front with a 90° angle of the elbow. Our model incorrectly interpreted this movement as the using of hands.
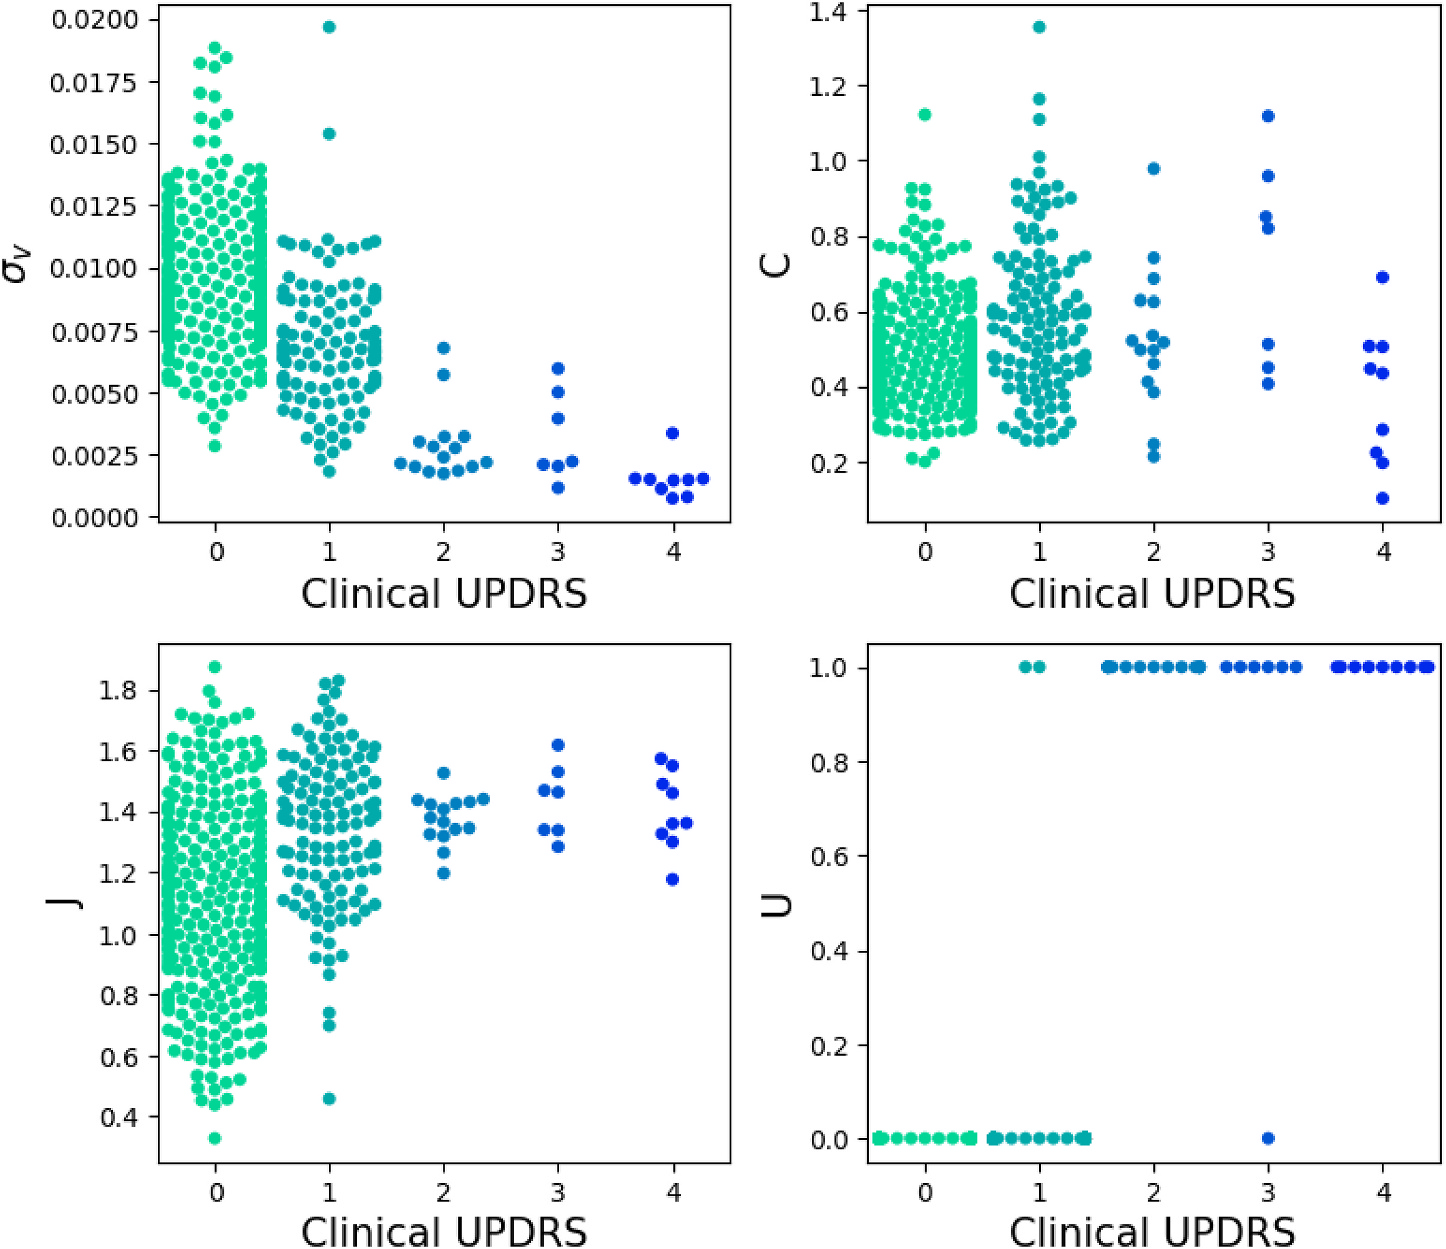
Figure 5 shows how each of the four features are distributed, conditional upon UPDRS rating. The far left plot shows that σ is lower for higher scoring patients, the inner left plot shows that C does not have a clear linear relationship with score, the inner right plot shows that J increases with score, and the far right plot shows that U tends to be 1 for UPDRS scores of 2 and higher.
In the far right plot three “outliers” are evident. For the first outlier the patient did not use their hands to assist while standing up, and U was correctly estimated as 0. However, the clinician UPDRS rating was 3, which appears to not follow the MDS-UPDRS instructions (Table 1), which state that a rating of more than 1 should only be given if the patient needed to use their hands.7
For the second outlier, the patient used their hands for assistance, and U was correctly estimated as 1. However the clinician UPDRS rating was 1, which again appears to not follow the MDS-UPDRS instructions completely as it states that ratings of 0 or 1 should only be given if there was “No need to use the arms of the chair”.7 For the final outlier, the patient did not use their hands for assistance, and U was misclassified as 1.
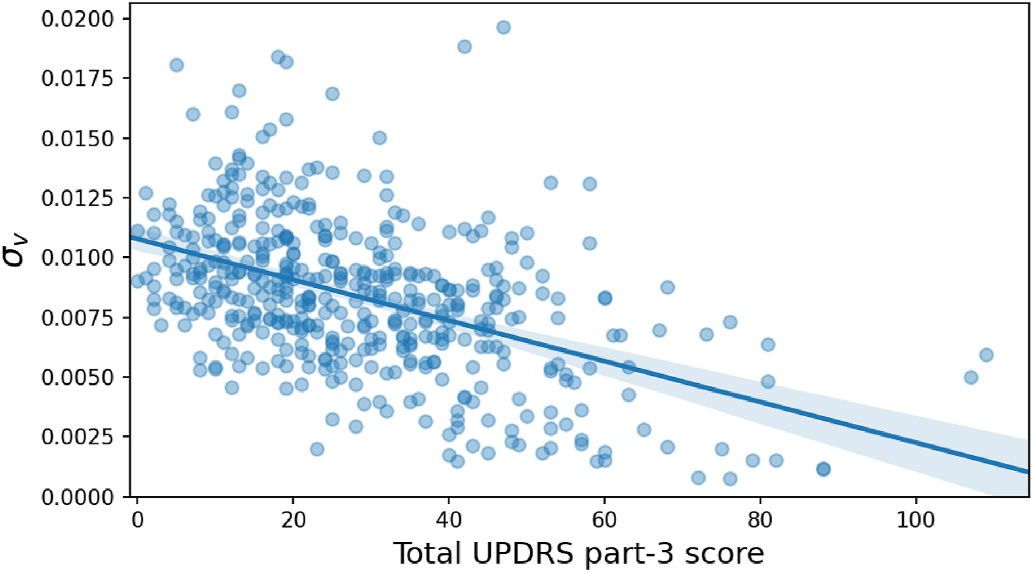
These features were designed to estimate MDS-UPDRS item 3.9 scores, however each of the three continuous features also correlate significantly (p < 0.01) with the total MDS-UPDRS part-3 score of patients. The Pearson’s r between σ, C, J and UPDRS are −0.475, 0.122 and 0.289, respectively. Figure 6 shows the distribution of σ in relation to total MDS-UPDRS part-3.
3.2. Model performance
Figure 7 shows the feature importance for each of the four random forest classifiers, which make up the ordinal classifier system.
The importance of features vary by classifier in the way we expect, given the MDS-UPDRS instructions (see Table 1). Patients can only score 0–1 if they do not use their hands, hence U is most important for the {0,1} vs {2,3,4} classifier. Patients can only score a 0 if there are no hesitations, hence J has relatively high importance for the {0} vs {1,2,3,4} classifier. Generally speaking, the more attempts a patient makes to stand, the higher their score will be, hence σis an important feature for every classifier. C picks up subtle differences that are important both for the {0} vs {1,2,3,4} classifier (whether the patient has to lean forward slightly to successfully stand) and the {0,1,2,3} vs {4} classifier (patients who require help to stand will generally not be able to stand fully upright).
The confusion matrix of the model estimates (Table 5) shows the accuracy was 0.790, while the errors were less than or equal to one for all but two videos, which are discussed in more detail below.
Table 6 shows the binary confusion matrix, for which the accuracy was 0.812, with sensitivity of 0.628, and specificity of 0.903. The sensitivity and specificity for each class of the model are shown in Table 7 (note these metrics for class UPDRS = 0 are equivalent to the binary metrics).
4. Discussion
4.1. Outliers
The two examples for which the absolute differences between estimated and clinical UPDRS scores were greater than 1 (Table 5) were examined in more detail.
In the first of these cases, the patient was rated 3 by the clinician but estimated 1 by the model. In this case the patient was able to stand up within three attempts, and did not have to push up on the chair using their hands to assist them during the standing. We believe that in this case the model estimate bears a closer resemblance to the UPDRS instructions which state that for a rating 1 to be given if there was “No need to use the arms of the chair”.7
In the second case the patient was rated 4 by the clinician but estimated 2 by the model. In this case the patient could stand up without the help of the clinician. Again we believe that in this case the model estimate bears a closer resemblance to the official UPDRS instructions which state that for a rating of 4 the patient should be “Unable to arise without help”.7
We showed six videos, including these two outliers, to two senior neurologists3 and asked for their expert opinion. Among those six videos, the two neurologists disagreed with the clinician ratings in four cases, which included the two outliers, and provided re-ratings. For each of the four videos where there was a disagreement, the score of the neurologists’ re-rating was within one of the original rating, which is in line with the expectation that UPDRS ratings by assessors can commonly differ by one.24 Table 8 displays these re-ratings alongside the original ratings for the two outliers.
These re-rated scores for the two outliers were now within one of the model estimated UPDRS. Table 9 shows the metrics values before and after the re-rating of the outliers.
3Prof Patricia Limousin, UCL Queen Square Institute of Neurology. Prof Thomas Foltynie, UCL Queen Square Institute of Neurology.
4.2. Limitations
The model estimates agreed with clinician ratings in 79.2% of cases. Most disagreements (roughly 9 in 10) arose because the model had difficulties distinguishing between normal (UPDRS = 0) and slight impairment (UPDRS = 1). We also note our result may be less robust to the severe end of the PD spectrum, given the dataset contains a relatively small number of patients with UPDRS ratings of 3 or 4.
Our 2D vision-based analysis relied on 2D pose estimation. However, some potential PD biomarkers are difficult to extract from 2D information, such as arm stability.
Another limitation of our method is that the estimates are only made after first manually labelling the section of the video in which the arising from chair action is being carried out.
4.3. Further work
Further work will extend the system such that it automatically detects the relevant section of the video, using an algorithm that analyses the Dbody time-series, thus removing the need for a manual labelling step.
We could also seek to improve performance by adding additional features to the model, such as a count of the number of attempts before the patient could stand up. Additionally, different modelling methodologies could be investigated, such as alternative ordinal classification frameworks.
Recent advances in 3D pose estimation have been applied to Gait analysis,36,37 and could similarly be applied to arising from chair. Thus, further work could make use of 3D pose estimation from monocular images,38,39 which would allow these biomarkers to be extracted with greater accuracy. Additionally we note that continued advancements, such as LiDAR or Time of Flight technologies being integrated with modern consumer mobile device cameras, will improve the accuracy of 3D estimation techniques and make 3D pose estimation solutions more readily deployable.
5. Conclusions
We demonstrate a computer vision-based method to automatically assess the severity of PD in patients, as it pertains to the arising from chair activity. The UPDRS ratings estimated by this system are shown to be within one of ratings made by trained clinicians in all cases, and agree exactly in 79.2% of cases. Our system could robustly analyse sitting to standing using a set of data that contained 447 videos of patients from five clinical sites compared to previous studies involving less than 50 patients.9,10,11,40
The system used an ordinal random forest classifier with four features extracted from two time-series signals. These features captured the key characteristics listed in the MDS-UPDRS manual for the arising from chair examination; speed variation, smoothness, if patients used their hands, and how much a patient leaned forward while sitting down and how erect a patient could stand. This means the results of our system are highly interpretable, particularly when compared to “black box” systems such as convolutional or recurrent neural nets.
This approach has the potential to be used for quality control and prevention of human error by identifying unusual clinician ratings. We exemplified this by examining two cases for which the difference between model and clinician rating was greater than one. When presented to senior neurologists, both cases were determined to have been given incorrect ratings by the original assessors. This demonstrates the potential of this system to automatically find potentially unreliable ratings which may require secondary review by experts.
Remote assessment could benefit patients by reducing the time and cost required to attend appointments41 and also enable remote assessment as outcome measures in clinical trials, which is of particular importance for severely disabled patients who may have difficulties travelling to and from the clinic. The accuracy of automated computer-vision based remote assessment is affected by the quality of data collected, which can be negatively impacted by factors such as poor lighting, camera instability and crowded backgrounds. However, these factors can be minimised with clear and standardised set up instructions.
Use of a smartphone for remote assessment has gained a lot of attention recently,18,42,43 and most of the PD motor examination could be performed remotely.44,45 Arising from chair is an ideal candidate for home assessment when compared to other MDS-UPDRS items which measure axial impairment, such as gait (which requires a long hallway) or postural stability (which requires the assistance of an additional person). We found that our model features correlate significantly with overall disease severity, as measured by total UPDRS part-3 score. This indicates that our tool can not only be used to monitor ability to perform the arising from chair action, but could also be used to track general disease progression.
In conclusion, we show that the ability of PD patients to perform the arising from chair action can be measured accurately using singular monocular video, recorded using widely available consumer mobile devices, in normal clinical settings. This opens the door to such a system being used routinely for clinical assessments and as outcome measures in clinical trials, either locally or remotely.
6. Summary table
What is already known:
- The ability to arise from a sitting to a standing position is often impaired in Parkinson’s disease (PD). This impairment is associated with an increased risk of falling, and higher risk of dementia.
- The most common way to assess arising from chair in PD patients is the Movement Disorder Society sponsored Unified PD Rating Scale (MDS-UPDRS). These MDS-UPDRS scores are subjective in character, with assessors opinion often differing by 1 point, making quality control hard to achieve.
What this study has added:
- An approach to estimating MDS-UPDRS scores using only video data collected using widely available consumer mobile technology, such as smartphones or tablets.
- Automated analysis of these videos, using 2D pose estimation, can robustly estimate disease severity, with estimated scores being within 1 of those assigned by trained assessors in every instance.
- The system is a good candidate for routine in office use or for remote home assessment of patients.
Figures
Tables
Instructions to examiner: Have the patient sit in a straight-backed chair with arms, with both feet on the floor and sitting back in the chair (if the patient is not too short). Ask the patient to cross his/her arms across the chest and then to stand up. If the patient is not successful, repeat this attempt a maximum up to two more times. If still unsuccessful, allow the patient to move forward in the chair to arise with arms folded across the chest. Allow only one attempt in this situation. If unsuccessful, allow the patient to push off using his/her hands on the arms of the chair. Allow a maximum of three trials of pushing off. If still not successful, assist the patient to arise. After the patient stands up, observe the posture for item 3.13.

Table 1. MDS-UPDRS instructions to assessors for rating item 3.9 (arising from chair). The features in section 2.4 were designed to capture the characteristics mentioned in these instructions.↑a↑b↑c↑d↑e↑f↑g
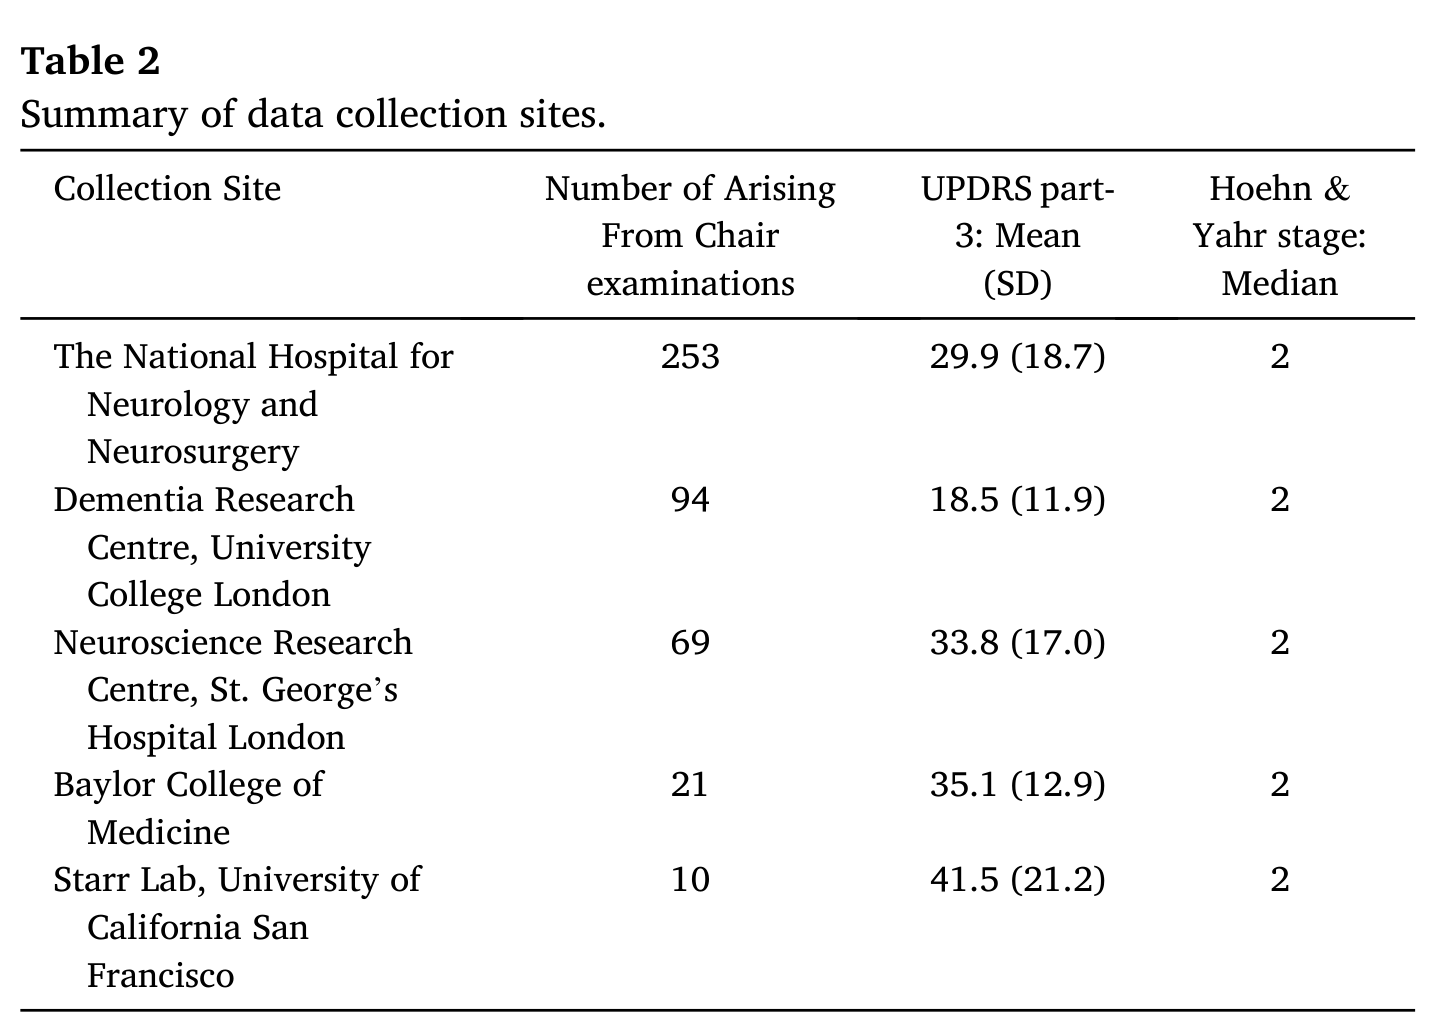
Table 2. Summary of data collection sites.↑
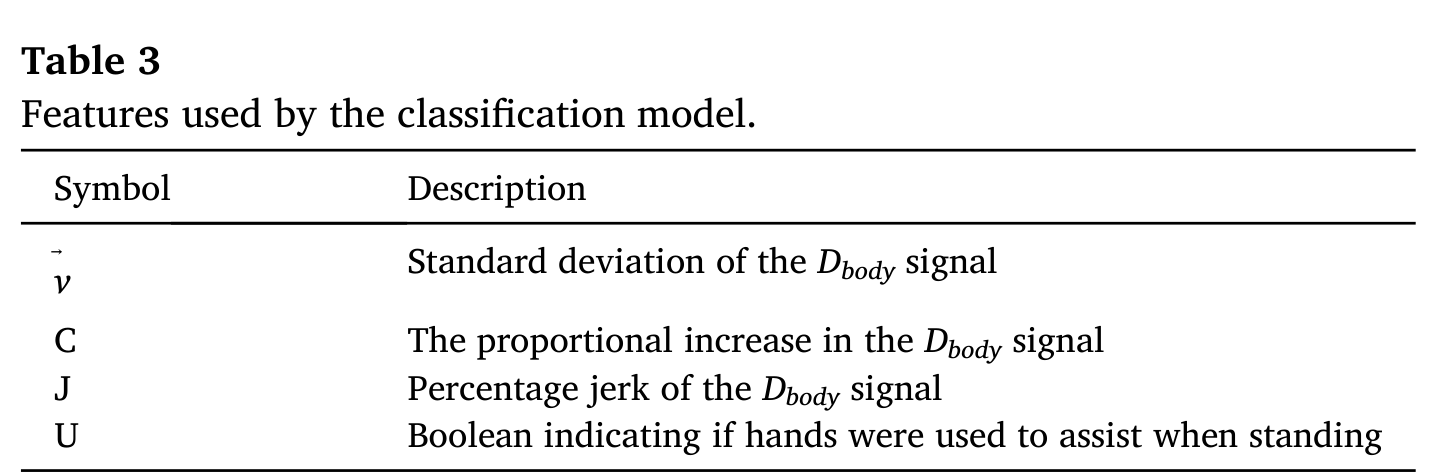
Table 3. Features used by the classification model.↑
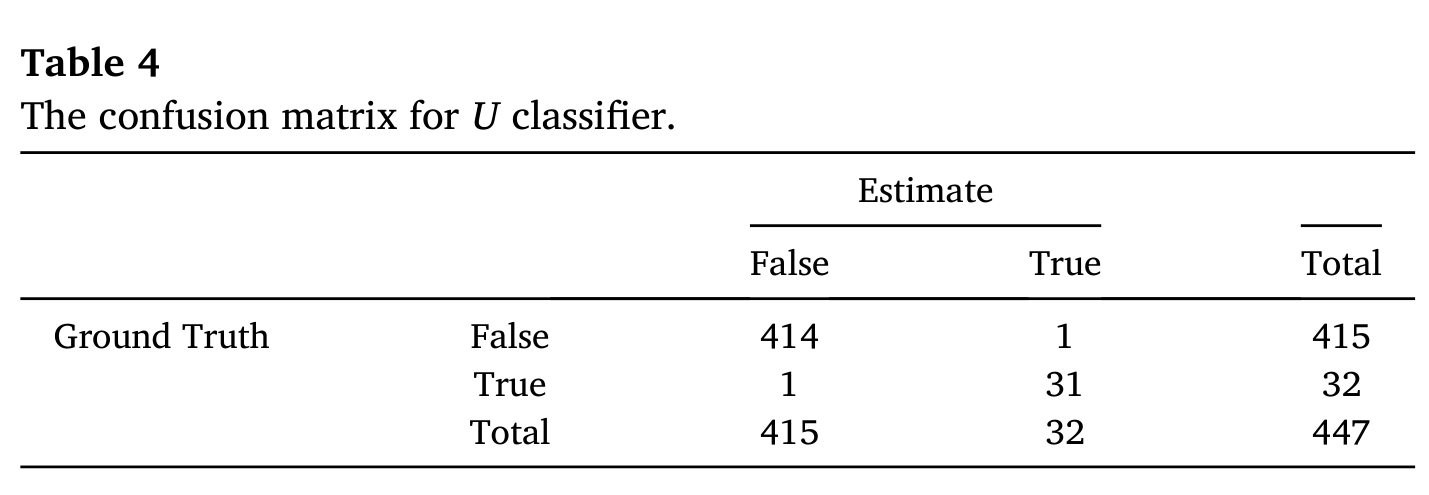
Table 4. The confusion matrix for U classifier.↑
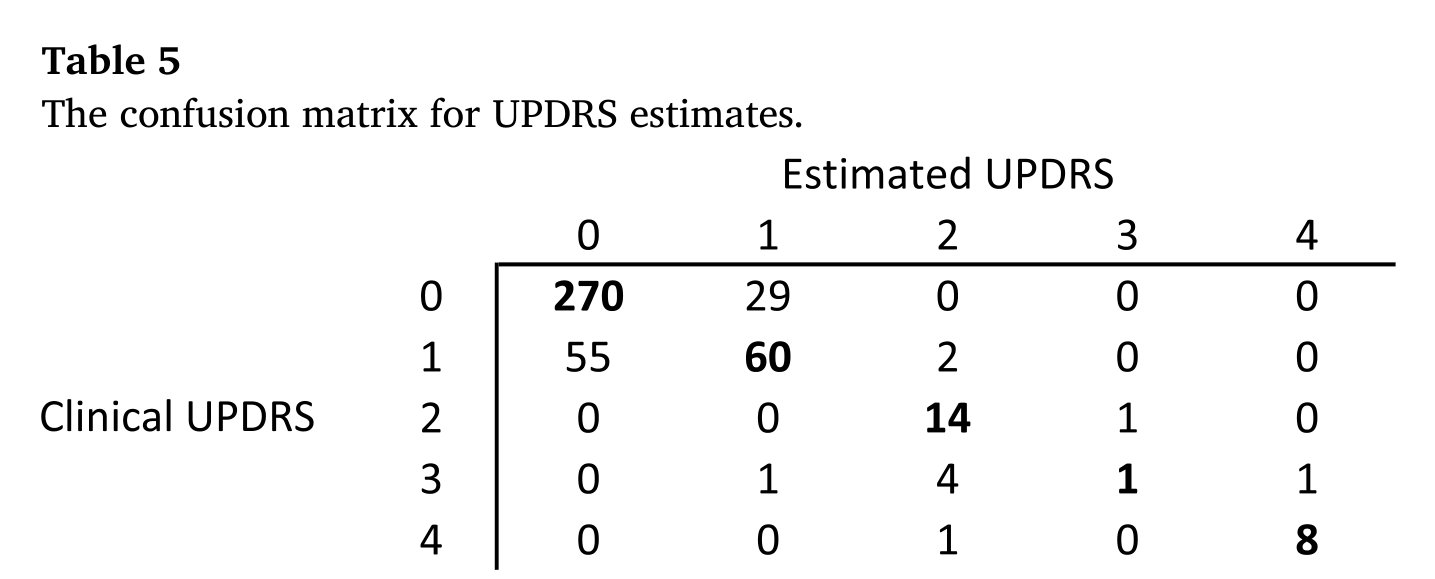
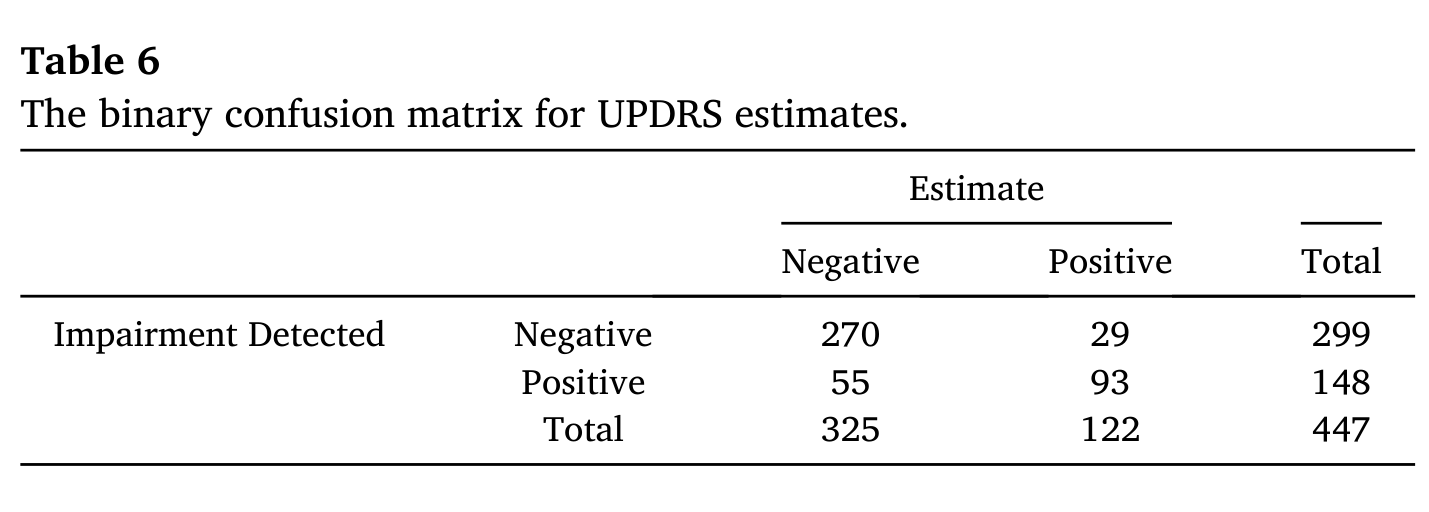
Table 6. The binary confusion matrix for UPDRS estimates.↑
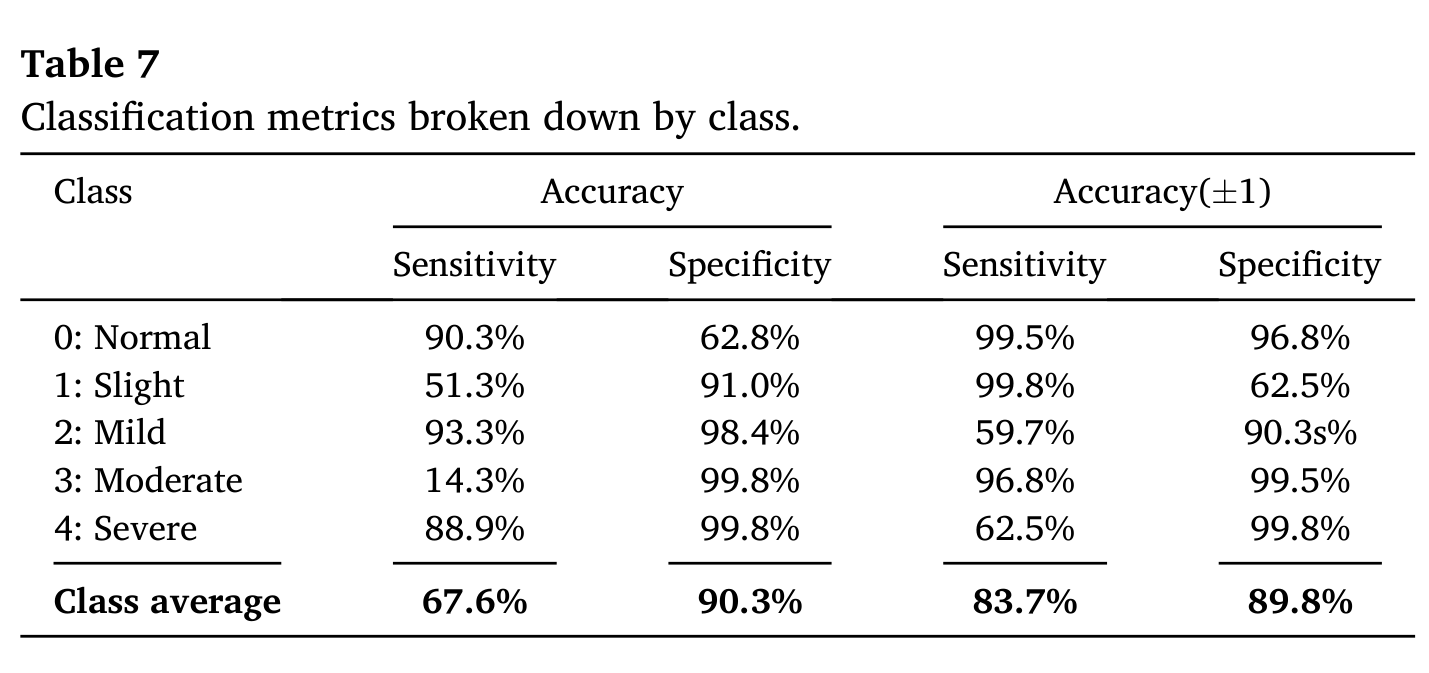
Table 7. Classification metrics broken down by class.↑
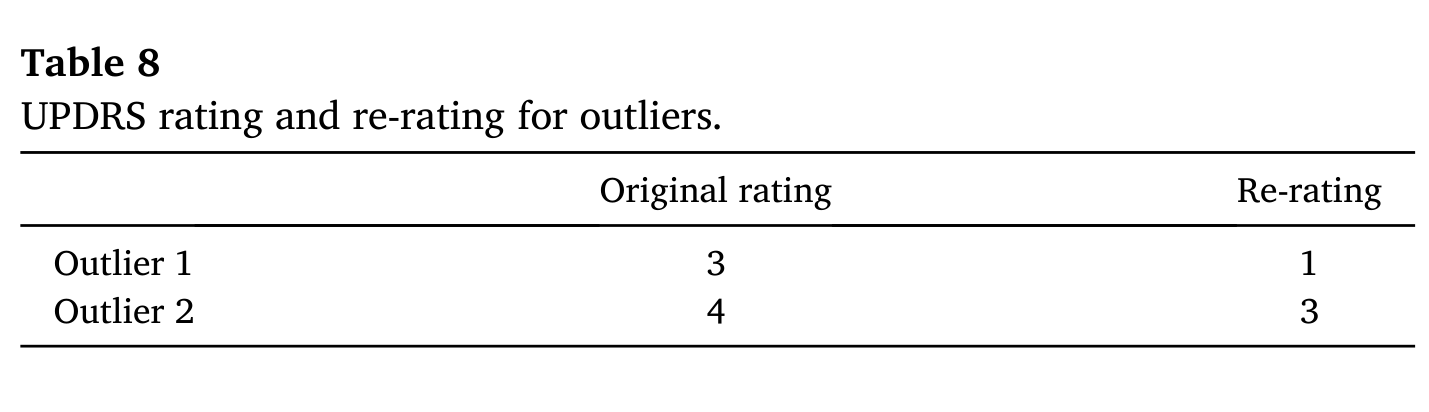
Table 8. UPDRS rating and re-rating for outliers.↑
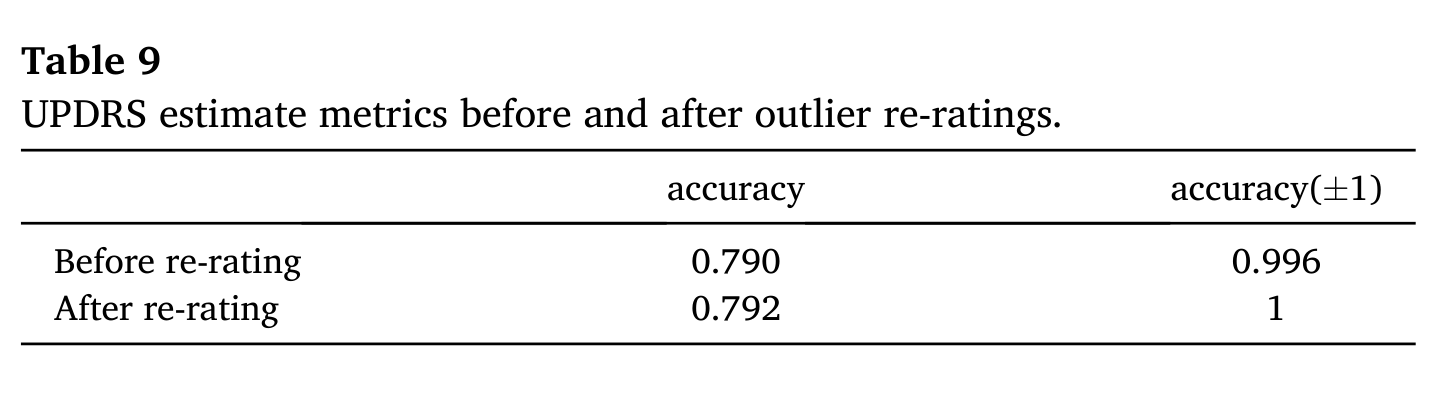
Table 9. UPDRS estimate metrics before and after outlier re-ratings.↑
Author contributions
Gareth Morinan contributed to the design of the analysis, performed data analysis, created figures, and wrote the manuscript. Yuwei Peng contributed to the design of the analysis, performed data analysis, created figures, and contributed to the editing of the manuscript. Samuel Rupprechter contributed to the editing of the manuscript. Rimona S. Weil, Louise-Ann Leyland, Thomas Foltynie, Krista Sibley, Fahd Baig, Francesca Morgante, Ro’ee Gilron, Robert Wilt and Philip Starr contributed to data collection. Jonathan O’Keeffe designed the analysis, and contributed to the editing of the manuscript. All authors have read and approved the final manuscript.
Statement of experimentation with human subjects
The authors state that ethics agreements and informed consent have been obtained for studies on patients. Ethics agreements are in place and handled by each department we are working with. Moreover, data sharing agreement has been obtained with each department that covers the use of the data for this purpose.
Declaration of competing interest
The authors declare that they have no known competing financial interests or personal relationships that could have appeared to influence the work reported in this paper.
Acknowledgements
This study was funded by Innovate UK, Capital Enterprise, and Machine Medicine Technologies. Data was collected at the National Hospital for Neurology and Neurosurgery, UCLH, Dementia Research Centre, UCL, Starr Lab, UCSF, Neuroscience Research Centre, St George’s University of London, and Baylor College of Medicine. Expert opinions on outliers were provided by Prof Patricia Limousin, UCL Queen Square Institute of Neurology, and Prof Thomas Foltynie, UCL Queen Square Institute of Neurology.
Appendix A. Supplementary data
Supplementary data to this article can be found online at https://doi.org/10.1016/j.ibmed.2021.100046.
References
- Tysnes, O.B.; Storstein, A. Epidemiology of Parkinson's disease. Journal of Neural Transmission 124, 901–905 (2017).↑
- Steiger, M.; Thompson, P.; Marsden, C. Disordered axial movement in Parkinson's disease. Journal of Neurology, Neurosurgery and Psychiatry 61, 645–648 (1996).↑a↑b
- Levy, G.; Tang, M.-X.; Cote, L.J.; Louis, E.D.; Alfaro, B.; Mejia, H.; Stern, Y.; Marder, K. Motor impairment in PD: relationship to incident dementia and age. Neurology 55, 539–544 (2000).↑a↑b
- Schrag, A.; Choudhury, M.; Kaski, D.; Gallagher, D.A. Why do patients with Parkinson's disease fall? A cross-sectional analysis of possible causes of falls. npj Parkinson's Disease 1, 1–6 (2015).↑
- Dennison, A.C.; Noorigian, J.V.; Robinson, K.M.; Fisman, D.N.; Cianci, H.J.; Moberg, P.; Bunting-Perry, L.; Martine, R.; Duda, J.; Stern, M.B. Falling in Parkinson disease: identifying and prioritizing risk factors in recurrent fallers. American Journal of Physical Medicine & Rehabilitation 86, 621–632 (2007).↑
- Franchignoni, F.; Martignoni, E.; Ferriero, G.; Pasetti, C. Balance and fear of falling in Parkinson's disease. Parkinsonism & Related Disorders 11, 427–433 (2005).↑
- Goetz, C.G.; Tilley, B.C.; Shaftman, S.R.; Stebbins, G.T.; Fahn, S.; Martinez-Martin, P.; Poewe, W.; Sampaio, C.; Stern, M.B.; Dodel, R.; et al. Movement Disorder Society-sponsored revision of the Unified Parkinson's disease rating scale (MDS-UPDRS): scale presentation and clinimetric testing results. Movement Disorders 23, 2129–2170 (2008).↑a↑b↑c↑d↑e↑f
- Post, B.; Merkus, M.P.; de Bie, R.M.; de Haan, R.J.; Speelman, J.D. Unified Parkinson's disease rating scale motor examination: are ratings of nurses, residents in neurology, and movement disorders specialists interchangeable? Movement Disorders 20, 1577–1584 (2005).↑
- Tosi, J.; Summa, S.; Taffoni, F.; Biase, L.D.; Marano, M.; Rizzo, A.C.; Tombini, M.; Schena, E.; Formica, D.; Pino, G.D. Feature extraction in sit-to-stand task using m-IMU sensors and evaluation in Parkinson's disease. In IEEE International Symposium on Medical Measurements and Applications (MeMeA), 1–6 (2018).↑a↑b↑c
- Zijlstra, A.; Mancini, M.; Lindemann, U.; Chiari, L.; Zijlstra, W. Sit-stand and stand-sit transitions in older adults and patients with Parkinson's disease: event detection based on motion sensors versus force plates. Journal of NeuroEngineering and Rehabilitation 9, 75 (2012).↑a↑b
- Mak, M.K.; Yang, F.; Pai, Y.-C. Limb collapse, rather than instability, causes failure in sit-to-stand performance among patients with Parkinson disease. Physical Therapy 91, 381–391 (2011).↑a↑b↑c
- LeMoyne, R. Wearable and wireless accelerometer systems for monitoring Parkinson's disease patients—a perspective review. Advances in Parkinson's Disease 2, 113–115 (2013).↑
- Migueles, J.H.; Cadenas-Sanchez, C.; Ekelund, U.; Nyström, C.D.; Mora-Gonzalez, J.; Löf, M.; Labayen, I.; Ruiz, J.R.; Ortega, F.B. Accelerometer data collection and processing criteria to assess physical activity and other outcomes: a systematic review and practical considerations. Sports Medicine 47, 1821–1845 (2017).↑
- Kilsdonk, E.; Peute, L.; Jaspers, M.W. Factors influencing implementation success of guideline-based clinical decision support systems: a systematic review and gaps analysis. International Journal of Medical Informatics 98, 56–64 (2017).↑
- Achey, M.; Aldred, J.L.; Aljehani, N.; Bloem, B.R.; Biglan, K.M.; Chan, P.; Cubo, E.; Dorsey, E.R.; Goetz, C.G.; Guttman, M.; et al. The past, present, and future of telemedicine for Parkinson's disease. Movement Disorders 29, 871–883 (2014).↑
- Liu, Y.; Chen, J.; Hu, C.; Ma, Y.; Ge, D.; Miao, S.; Xue, Y.; Li, L. Vision-based method for automatic quantification of parkinsonian bradykinesia. IEEE Transactions on Neural Systems and Rehabilitation Engineering 27, 1952–1961 (2019).↑
- Sato, K.; Nagashima, Y.; Mano, T.; Iwata, A.; Toda, T. Quantifying normal and parkinsonian gait features from home movies: practical application of a deep learning-based 2D pose estimator. PLoS ONE 14, 1–15 (2019).↑
- Pan, D.; Dhall, R.; Lieberman, A.; Petitti, D.B. A mobile cloud-based Parkinson's disease assessment system for home-based monitoring. JMIR mHealth and uHealth 3, e29 (2015).↑a↑b
- Stamate, C.; Magoulas, G.D.; Küppers, S.; Nomikou, E.; Daskalopoulos, I.; Jha, A.; Pons, J.; Rothwell, J.; Luchini, M.U.; Moussouri, T.; et al. The cloudUPDRS app: a medical device for the clinical assessment of Parkinson's disease. Pervasive and Mobile Computing 43, 146–166 (2018).↑
- Lu, M.; Poston, K.; Pfefferbaum, A.; Sullivan, E.V.; Fei-Fei, L.; Pohl, K.M.; Niebles, J.C.; Adeli, E. Vision-based estimation of MDS-UPDRS gait scores for assessing Parkinson's disease motor severity. In International Conference on Medical Image Computing and Computer-Assisted Intervention, 637–647 (Springer, 2020).↑
- Williams, S.; Relton, S.D.; Fang, H.; Alty, J.; Qahwaji, R.; Graham, C.D.; Wong, D.C. Supervised classification of bradykinesia in Parkinson's disease from smartphone videos. Artificial Intelligence in Medicine 110, 101966 (2020).↑
- Peng, Y.; Morinan, G.; Rupprechter, S.; Vye, K.; Hauser, R.A.; O'Keeffe, J. A method to measure step frequency in Parkinson's disease using monocular video (N.D.). Unpublished.↑
- O'Keeffe, J. CNS Summit: selected abstracts from the 2019 meeting: assessment of Parkinson's disease severity using machine learning. Innovations in Clinical Neuroscience 16, S5–S19 (2020).↑a↑b
- Goetz, C.G.; Stebbins, G.T.; Chmura, T.A.; Fahn, S.; Poewe, W.; Tanner, C.M. Teaching program for the movement disorder society-sponsored revision of the unified Parkinson's disease rating scale: (MDS-UPDRS). Movement Disorders 25, 1190–1194 (2010).↑a↑b↑c
- Lumley, T.; McNamara, T.F. Rater characteristics and rater bias: implications for training. Language Testing 12, 54–71 (1995).↑
- Hoyt, W.T. Rater bias in psychological research: when is it a problem and what can we do about it? Psychological Methods 5, 64 (2000).↑
- Chiang, K.-S.; Bock, C.; El Jarroudi, M.; Delfosse, P.; Lee, I.; Liu, H. Effects of rater bias and assessment method on disease severity estimation with regard to hypothesis testing. Plant Pathology 65, 523–535 (2016).↑
- Machine Medicine Technologies Limited. The company's webplatform. https://kelvin.machinemedicine.com/ (2021).↑
- Hoehn, M.M.; Yahr, M.D.; et al. Parkinsonism: onset, progression, and mortality. Neurology 50, 318 (1998).↑
- Keezer, M.R.; Wolfson, C.; Postuma, R.B. Age, gender, comorbidity, and the MDS-UPDRS: results from a population-based study. Neuroepidemiology 46, 222–227 (2016).↑
- Cao, Z.; Hidalgo, G.; Simon, T.; Wei, S.-E.; Sheikh, Y. OpenPose: realtime multi-person 2D pose estimation using part affinity fields. arXiv:1812.08008 (2018).↑a↑b
- CMU-Perceptual-Computing-Lab. The GitHub repository for OpenPose. https://github.com/CMU-Perceptual-Computing-Lab/openpose (2021).↑
- Frank, E.; Hall, M. A simple approach to ordinal classification. In European Conference on Machine Learning (ECML), 145–156 (Springer, Berlin, 2001).↑
- Pedregosa, F.; Varoquaux, G.; Gramfort, A.; Michel, V.; Thirion, B.; Grisel, O.; Blondel, M.; Prettenhofer, P.; Weiss, R.; Dubourg, V.; et al. Scikit-learn: machine learning in Python. Journal of Machine Learning Research 12, 2825–2830 (2011).↑
- Breiman, L. Bagging predictors. Machine Learning 24, 123–140 (1996).↑
- Mehrizi, R.; Peng, X.; Zhang, S.; Liao, R.; Li, K. Automatic health problem detection from gait videos using deep neural networks. arXiv:1906.01480 (2020).↑
- Guo, Y.; Deligianni, F.; Gu, X.; Yang, G.-Z. 3-D canonical pose estimation and abnormal gait recognition with a single RGB-D camera. IEEE Robotics and Automation Letters 4, 3617–3624 (2019).↑
- Dabral, R.; Gundavarapu, N.B.; Mitra, R.; Sharma, A.; Ramakrishnan, G.; Jain, A. Multi-person 3D human pose estimation from monocular images. In International Conference on 3D Vision (3DV), 405–414 (2019).↑
- Bogo, F.; Kanazawa, A.; Lassner, C.; Gehler, P.; Romero, J.; Black, M.J. Keep it SMPL: automatic estimation of 3D human pose and shape from a single image. In European Conference on Computer Vision, 561–578 (Springer, 2016).↑
- Mak, M.; Hui-Chan, C. The speed of sit-to-stand can be modulated in Parkinson's disease. Clinical Neurophysiology 116, 780–789 (2005).↑
- Alajmi, D.; Almansour, S.; Househ, M.S. Recommendations for implementing telemedicine in the developing world. In ICIMTH, 118–120 (2013).↑
- Kassavetis, P.; Saifee, T.A.; Roussos, G.; Drougkas, L.; Kojovic, M.; Rothwell, J.C.; Edwards, M.J.; Bhatia, K.P. Developing a tool for remote digital assessment of Parkinson's disease. Movement Disorders Clinical Practice 3, 59–64 (2016).↑
- Hauser, R.A.; Lyons, K.E.; Pahwa, R. The UPDRS-8: a brief clinical assessment scale for Parkinson's disease. International Journal of Neuroscience 122, 333–337 (2012).↑
- Dorsey, E.R.; Deuel, L.M.; Voss, T.S.; Finnigan, K.; George, B.P.; Eason, S.; Miller, D.; Reminick, J.I.; Appler, A.; Polanowicz, J.; et al. Increasing access to specialty care: a pilot, randomized controlled trial of telemedicine for Parkinson's disease. Movement Disorders 25, 1652–1659 (2010).↑
- Cubo, E.; Trejo Gabriel-Galán, J.M.; Seco Martínez, J.; Rioja Alcubilla, C.; Yang, C.; Fernández Arconada, O.; Mariscal Pérez, N. Comparison of office-based versus home web-based clinical assessments for Parkinson's disease. Movement Disorders 27, 308–311 (2012).↑